. 2022 Mar 14;28(6):1127–1135. doi: 10.1158/1078-0432.CCR-21-2595

Figure 2.

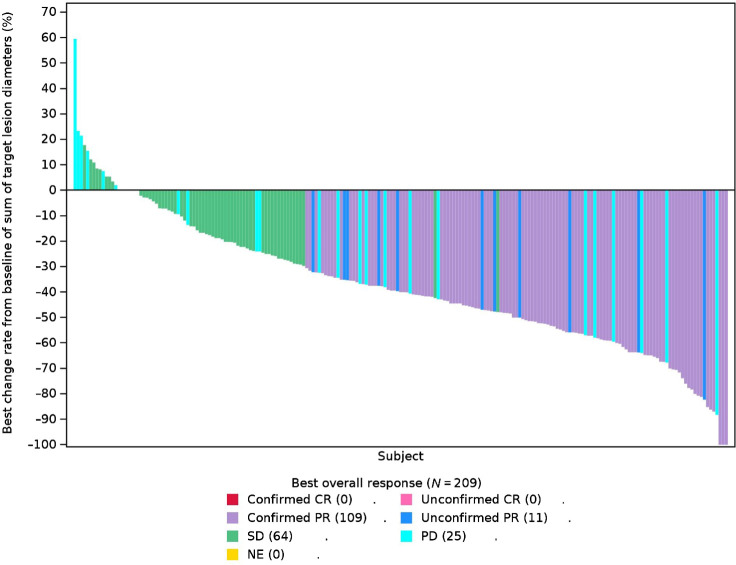
Figure 2. Best percentage change from baseline in target lesion size by investigator assessment in evaluable patients. Waterfall plots for best percentage change in target lesion size are shown for evaluable patients in phase II. The color key indicates the response to 300 mg twice a day of abivertinib. Abbreviation: NE, not evaluable

Best percentage change from baseline in target lesion size by investigator assessment in evaluable patients. Waterfall plots for best percentage change in target lesion size are shown for evaluable patients in phase II. The color key indicates the response to 300 mg twice a day of abivertinib. Abbreviation: NE, not evaluable