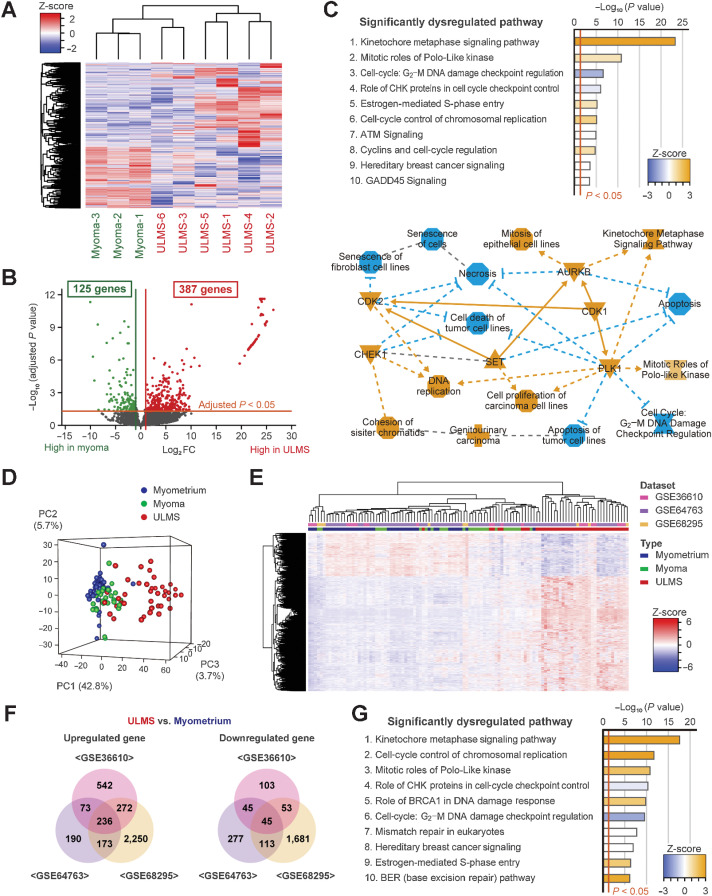
Figure 1.
Transcriptome analysis of ULMS using the GEO datasets and our cohort. A, The hierarchical clustering and heatmap showing 3,070 DEGs between ULMS and myoma. The DEGs were defined as an absolute log2 fold change exceeding 1. B, The volcano plot showing significant DEGs between ULMS and myoma. The adjusted P values for each gene were calculated by the Wald test in DESeq2. C, The top 10 significantly dysregulated pathways and the graphical summary based on IPA for the significant DEGs. The orange and blue nodes represent the activated and inhibited genes or pathways, respectively. The orange arrows and blue inhibitory arrows indicate activation and suppression, respectively. D, The principal component analysis. E, The hierarchical clustering and heatmap for GSE36610, GSE64763, and GSE68295 datasets. Each data were converted to z-scores and merged. A total of 1,683 DEGs were used for analyses. F, The Venn diagrams showing the significantly upregulated and downregulated genes between ULMS and myometrium in each dataset. G, The top 10 significantly dysregulated pathways for the three datasets. IPA was performed using the 282 significant DEGs in common.

