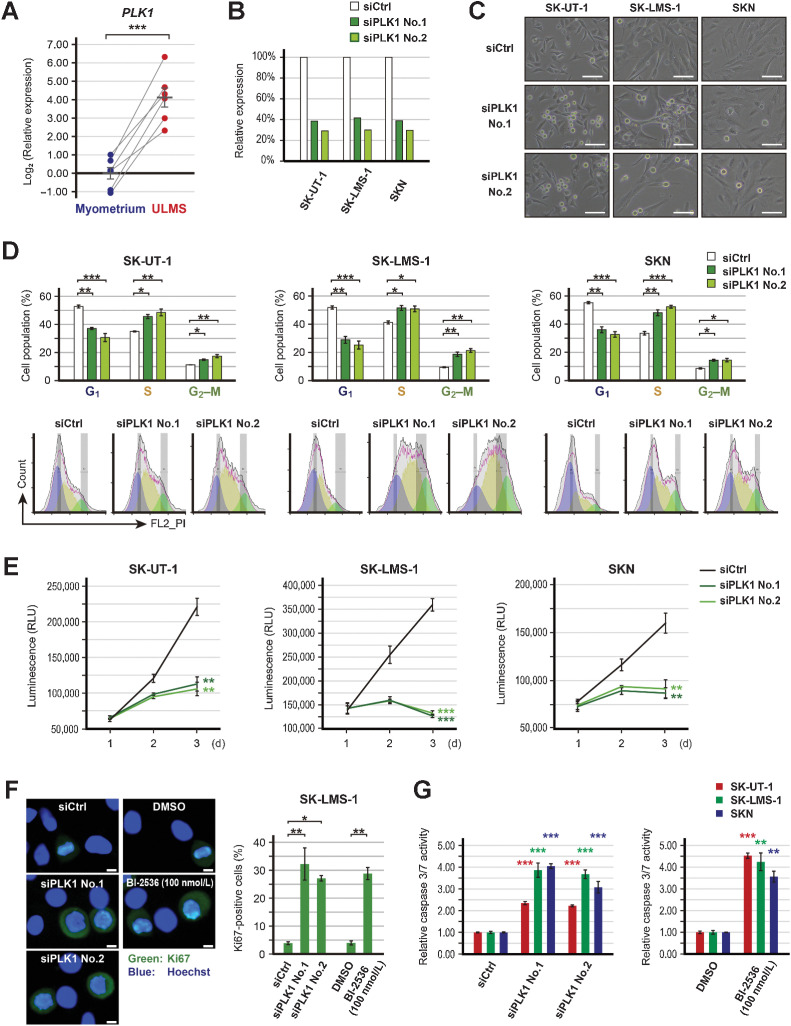
Figure 3.
Effects of PLK1 silencing. A, The relative expression of PLK1 in paired ULMS and myometrium. ACTB was used as a reference gene to normalize expression, and the relative expression was compared using the paired t test. B, Validation of PLK1 suppression following transfection with 3 nmol/L of siRNA for PLK1 (siPLK1). C, The representative images of siPLK1-transfected cells; scale bars, 100 µm. D, Cell-cycle distribution of siPLK1-transfected cells. Cell-cycle distribution was calculated by FlowJo. The experiments were performed in three independent replicates and the percentage of cells was compared using the Dunnett's test. E, The proliferation of siPLK1-transfected cells. Cell viability was measured at 24, 48, and 72 hours. Experiments were performed in triplicate and repeated three times. The luminescence was compared using the Dunnett's test. F, Immunofluorescent of Ki67 in SK-LMS-1 cells treated with PLK1 inhibition. Cells were treated with PLK1 inhibition for 24 hours. The experiments were performed in three independent replicates. The percentage of Ki67-positive cells was compared using Welch's t or Dunnett's tests. The green and blue colors indicate Ki67 and Hoechst, respectively; scale bars, 10 µm. G, The relative caspase 3/7 activity in cells treated with PLK1 inhibition. Caspase 3/7 activity was measured after 48 hours treatment. Experiments were performed in triplicate and repeated three times. The luminescence was compared using Welch's t or Dunnett's tests. Error bars represent standard errors of the mean, *, P < 0.05; **, P < 0.01; ***, P < 0.001.

