. 2022 Mar 18;28(10):2147–2159. doi: 10.1158/1078-0432.CCR-22-0100

Figure 5.

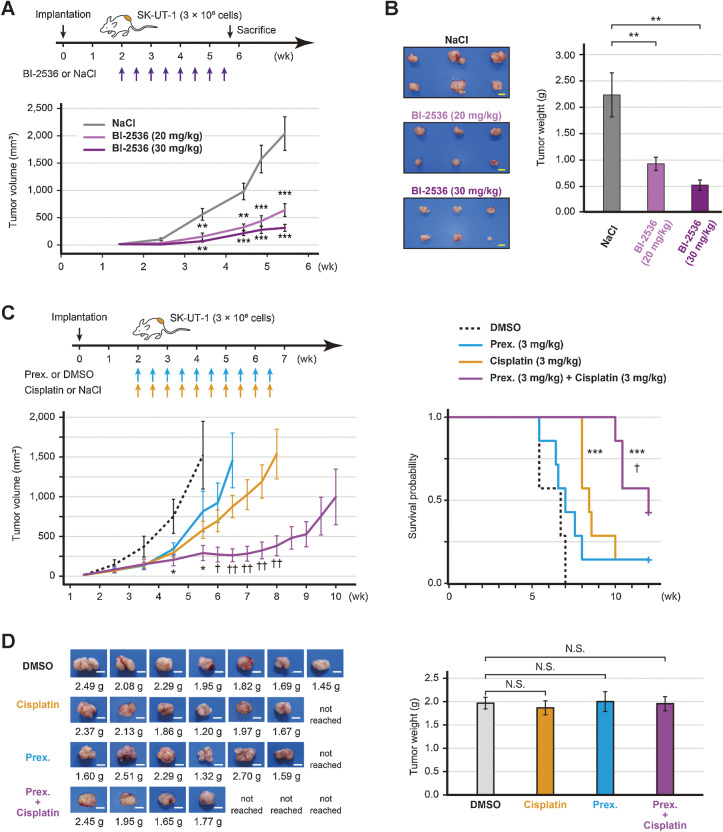
Figure 5. In vivo efficacy of BI-2536 or prexasertib. A, Estimated tumor volume of SK-UT-1 tumor-bearing mice treated with either BI-2536 monotherapy or saline (n = 6 per group). High-dose (30 mg/kg), low-dose (20 mg/kg) BI-2536, or saline was intraperitoneally administered twice a week for four weeks. B, The representative images of tumors and the mean tumor volume of SK-UT-1 tumor-bearing mice treated with either BI-2536 or saline. The mice were sacrificed when the tumors of the control mice reached a volume of 2,000 mm3. C, Estimated tumor volume and the Kaplan–Meier plot of SK-UT-1 tumor-bearing mice treated with the prexasertib and cisplatin combination therapy (n = 7 per group). Prexasertib monotherapy (3 mg/kg), cisplatin monotherapy (3 mg/kg), the prexasertib (3 mg/kg), and cisplatin (3 mg/kg) combination therapy, or vehicle (DMSO) was intraperitoneally administered twice a week for four weeks. The mice were sacrificed when the tumors reached a volume of 2,000 mm3. The tumor volume and weight were compared using Welch's t test, and survival was compared by a log-rank test. D, The representative images of tumors and the mean tumor volume of SK-UT-1 tumor-bearing mice treated with the prexasertib and cisplatin combination therapy. The tumor weight was compared using the Dunnett's test; scale bars, 1 cm. Error bars represent the standard errors of the mean. *, P < 0.05; **, P < 0.01; and ***, P < 0.001 (compared with control mice). †, P < 0.05 and ††, P < 0.01 (compared with cisplatin-treated mice); N.S., not significant.

In vivo efficacy of BI-2536 or prexasertib. A, Estimated tumor volume of SK-UT-1 tumor-bearing mice treated with either BI-2536 monotherapy or saline (n = 6 per group). High-dose (30 mg/kg), low-dose (20 mg/kg) BI-2536, or saline was intraperitoneally administered twice a week for four weeks. B, The representative images of tumors and the mean tumor volume of SK-UT-1 tumor-bearing mice treated with either BI-2536 or saline. The mice were sacrificed when the tumors of the control mice reached a volume of 2,000 mm3. C, Estimated tumor volume and the Kaplan–Meier plot of SK-UT-1 tumor-bearing mice treated with the prexasertib and cisplatin combination therapy (n = 7 per group). Prexasertib monotherapy (3 mg/kg), cisplatin monotherapy (3 mg/kg), the prexasertib (3 mg/kg) and cisplatin (3 mg/kg) combination therapy, or vehicle (DMSO) was intraperitoneally administered twice a week for four weeks. The mice were sacrificed when the tumors reached a volume of 2,000 mm3. The tumor volume and weight were compared using Welch's t test, and survival was compared by a log-rank test. D, The representative images of tumors and the mean tumor volume of SK-UT-1 tumor-bearing mice treated with the prexasertib and cisplatin combination therapy. The tumor weight was compared using the Dunnett's test; scale bars, 1 cm. Error bars represent the standard errors of the mean. *, P < 0.05; **, P < 0.01; ***, P < 0.001 (compared with control mice). †, P < 0.05; ††, P < 0.01 (compared with cisplatin-treated mice); N.S., not significant.