Figure 4. M cells are homogeneous while E cells can be clustered in three distinct groups.
(A–B) Jaccard indices for overlap in synaptic partners of M and E cells. Only includes synaptic partners that make medium or strong connections. Higher index values indicate more similarity in either inputs (A) or outputs (B). (C) Total input and output Synapse counts for M and E cells. (D–E) Strong shared connections of the four pdf +s LNvs. Only cells that share one connection with at least two M cells are shown. The strength (weight) of the connection is indicated. Only medium and strong connections are included. (D) The two cells that send strong connections to at least two M cells send strong connections to all four. (E) The six cells that receive strong connections from at least two M cells receive strong connections from all four. (F–G) Strong shared connections of the six LNds plus the 5th LNv (collectively referred to as E cells). Only cells that share a strong connection with at least two E cells are shown. The strength (weight) of the connection is indicated. Only medium and strong connections are included. (F) Cells that send strong connections to at least two E cells are included in the heatmap. (G) Cells that receive strong connections from at least two E cells are included in the heatmap.

Figure 4—figure supplement 1. Comparison of medium and strong inputs of 5th s-LNv relative to the pdf +s LNvs and the LNds.
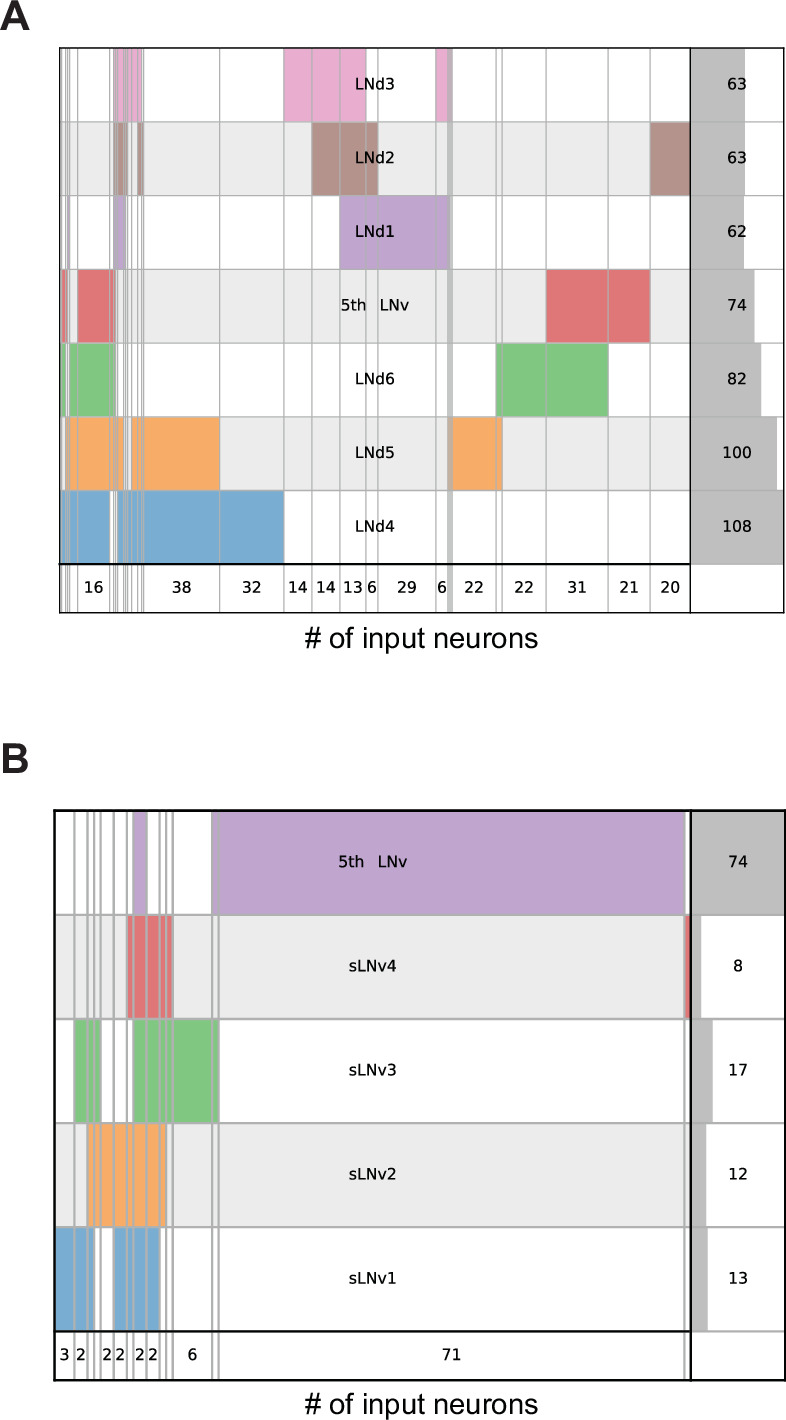
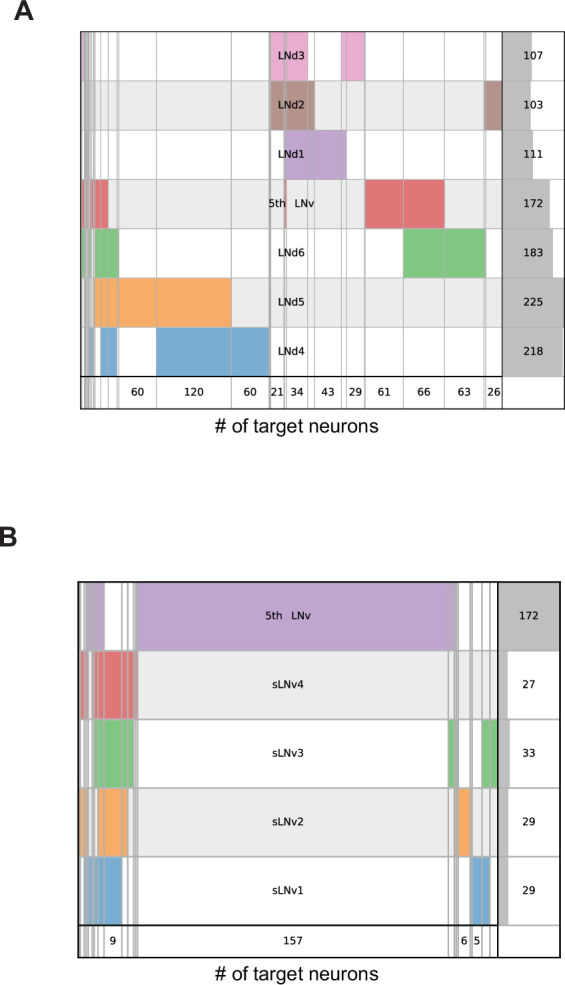
Figure 4—figure supplement 2. Comparison of medium and strong outputs of 5th s-LNv relative to the pdf +s LNvs and the LNds.