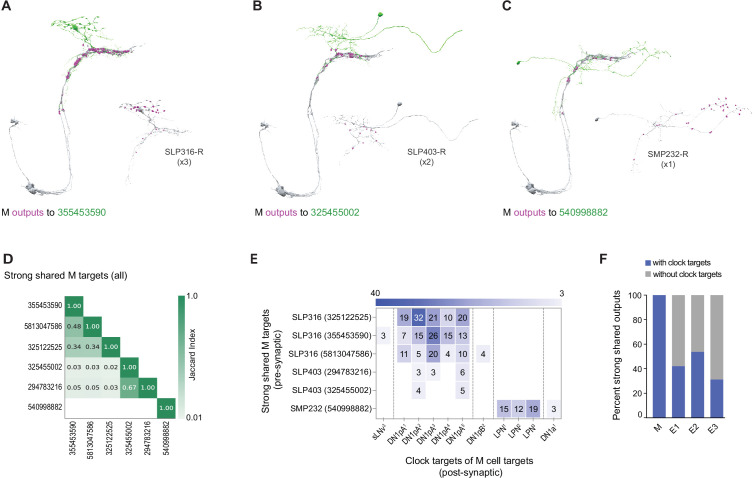
Figure 6. Strong shared outputs of M cells.
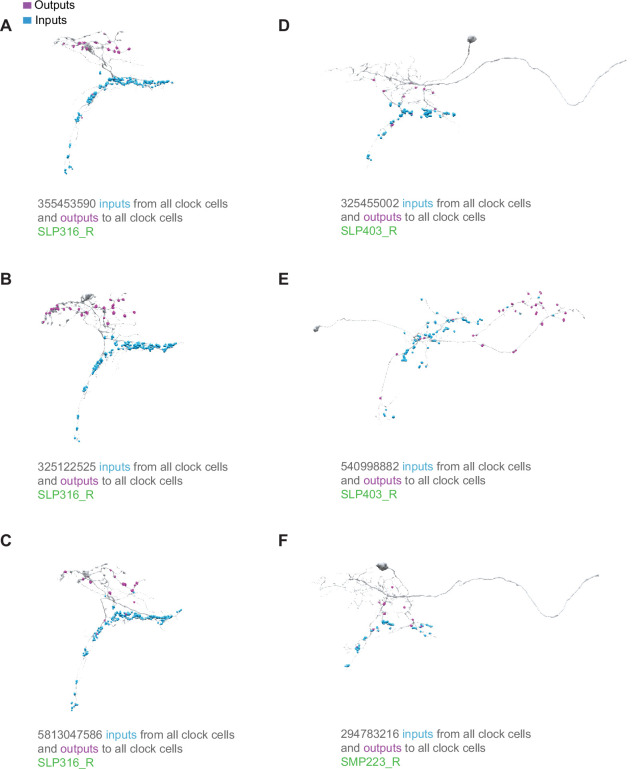
(A–C) The six cells that are strong shared outputs of the four M cells involve three different neuronal types (SPL316-R, SLP403-R, and SMP232-R). The M cells outputs onto each representative neuron of each type are shown in magenta. Representative target neurons are shown in green. (A) M cells contact three SPL316 neurons. Left, all four M cells are shown in gray and their contacts to 355453590 (neuronal morphology shown in green) are shown in magenta. Right: 355453590 is shown in gray and its outputs to clock cells are shown in magenta. (B) M cells contact two SPL403-R neurons. Left, all four M cells are shown in gray and their contacts to 325455002 (neuronal morphology shown in green) are shown in magenta. Right: 325455002 is shown in gray and its outputs to clock cells are shown in magenta. (C) M cells contact one SMP232-R neuron. Left: all four M cells are shown in gray and their contacts to 325455002 (neuronal morphology shown in green) are shown in magenta. Right: 325455002 is shown in gray and its outputs to clock cells are shown in magenta. (D) Jaccard index of the six M cell shared output cells. The index is based on the similarity of their outputs, the more similar their outputs are the higher the index value. Y and x-axis indicate the cell body ID of each of the six cells. Their neuronal type is indicated to the left of the body ID on the y-axis. Only indices ≥ 0.01 are shown. (E) All strong shared outputs of M cells in turn contact clock neurons. On the x-axis, the clock neurons that receive contacts from each cell are indicated. The values on the cells represent the weight of each connection. Medium and strong connections are included. (F) Percent of strong shared outputs of each neuronal class that in turn sends contacts to clock cells. Medium and strong connections are included. E1=LNd4 and LNd5, E2=LNd6 and the 5th s-LNv, E3=LNd1, LNd2, and LNd3.


