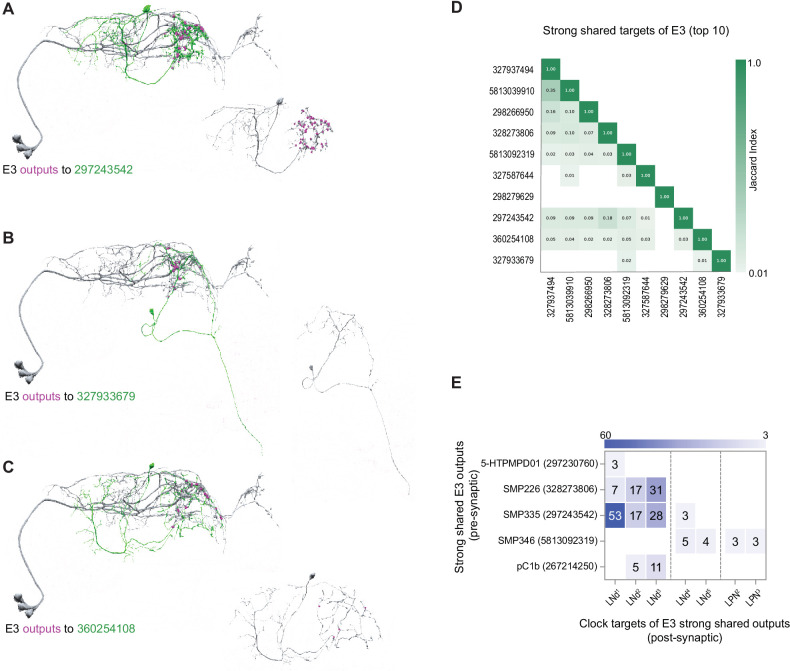
Figure 9. Strong shared outputs of E3.
(A–C) The cells that are strong shared outputs of E3 involve multiple neuronal types. E3 outputs onto three representative neurons are shown. E3 neurons (LNd1, LNd2, and LNd3) are shown in gray in the left panels, where representative output neurons are shown in green. On the right panels, each representative cell is shown in gray and its contacts to clock cells are shown in magenta. (A) Left, E3 neurons (shown in gray) contacts to SMP335 neuron 297243542 (shown in green) are shown in magenta. (B) Left, E3 neurons (shown in gray) contacts to SMP486 neuron 327933679 (shown in green) are shown in magenta. (C) Left, E3 neurons (shown in gray) contacts to SMP334 neuron 360254108 (shown in green) are shown in magenta. (D) Jaccard indices for the outputs of the top 11 E3 strong shared output cells. The index is based on the similarity of their outputs, the more similar their outputs are the higher the index value. Y and x-axis indicate the cell body ID of each of the cells. Only three cells are strong shared outputs of all E3 cells (E3a+E3 b). 8 cells are strong shared targets of E3a only. Only indices ≥ 0.01 are shown. (E) Shared outputs of any two E3 cells that contact clock cells. On the x-axis, the clock neurons that receive contacts from each cell are indicated. The values on the cells represent the weight of each connection. Medium and strong connections are included.

