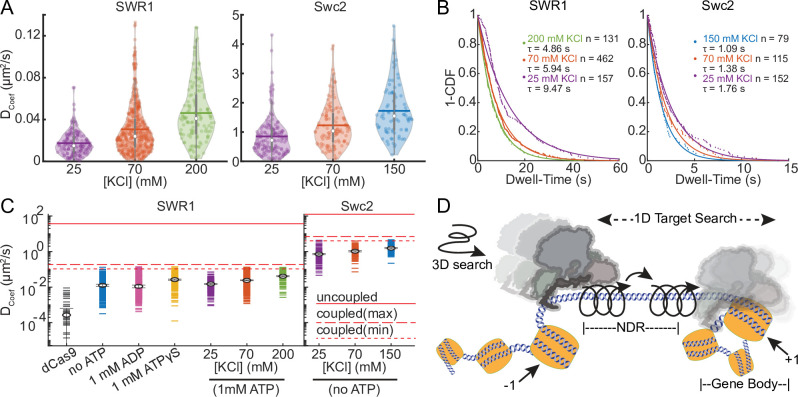
Figure 4. SWR1 and Swc2 DNA-binding domain (DBD) utilize a combination of sliding and hopping to scan DNA.
(A) Violin plots of diffusion coefficients for SWR1 and Swc2 DBD in increasing potassium chloride concentrations. Medians are shown as white circles and the mean is indicated with a thick horizontal line. 70 mM KCl represents the standard salt condition. (B) 1-CDF plots of SWR1 and Swc2 were fit to exponential decay functions to determine half-lives of binding in varying concentrations of potassium chloride. The number of molecules as well as half-lives determined is printed therein. Dots represent data points, while solid lines represent fits. Half-lives are calculated using the length of all the trajectories in each condition. (C) Upper limits for diffusion of SWR1 and Swc2 predicted using either a helically uncoupled model for hopping diffusion (uppermost solid red line) or a helically coupled model for sliding diffusion (lower dashed red lines). Two dashed lines are shown for helically coupled upper limits because the distance between the helical axis of DNA and the center of mass of either SWR1 or Swc2 is unknown. Markers represent median values. Dcoef values for each condition are shown as horizontal dashes, the number of molecules represented in each condition is as aforementioned. (D) A schematic representation of a model for how SWR1 likely performs 1D diffusion on DNA.
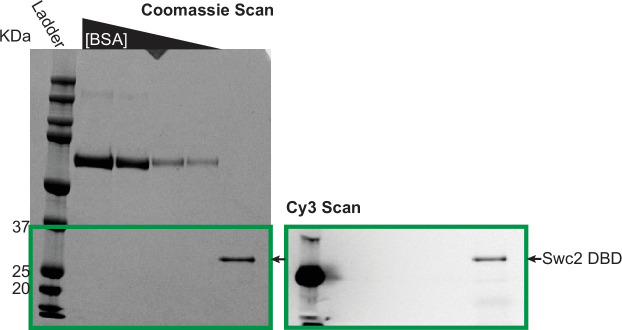
Figure 4—figure supplement 1. Purification and fluorophore labeling of the Swc2 DNA-binding domain (DBD).
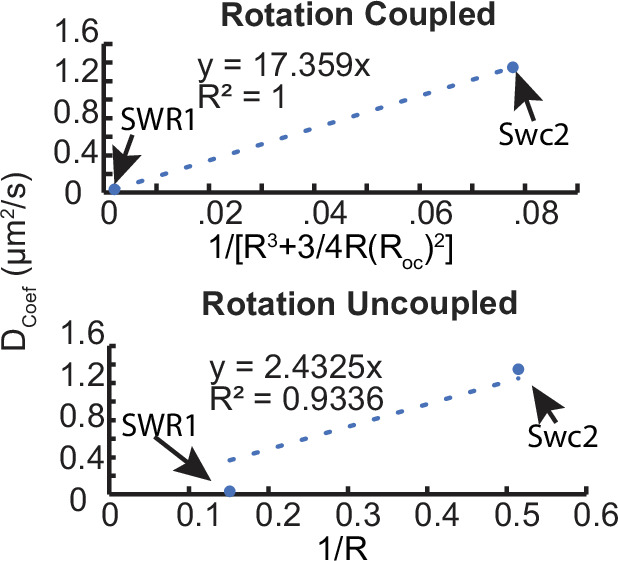
Figure 4—figure supplement 2. Rotation-coupled versus -uncoupled diffusion models and protein size effects on diffusion coefficient.


