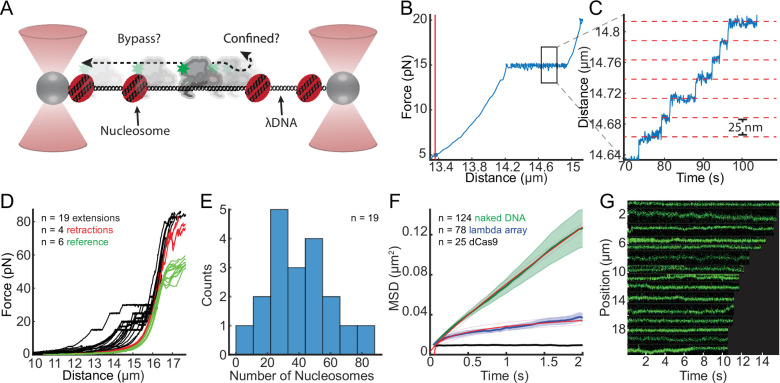
Figure 6. Nucleosomes confine SWR1 1D diffusion.
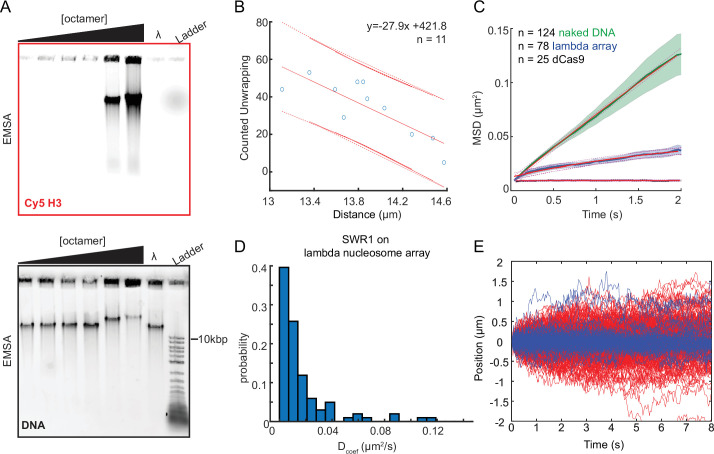
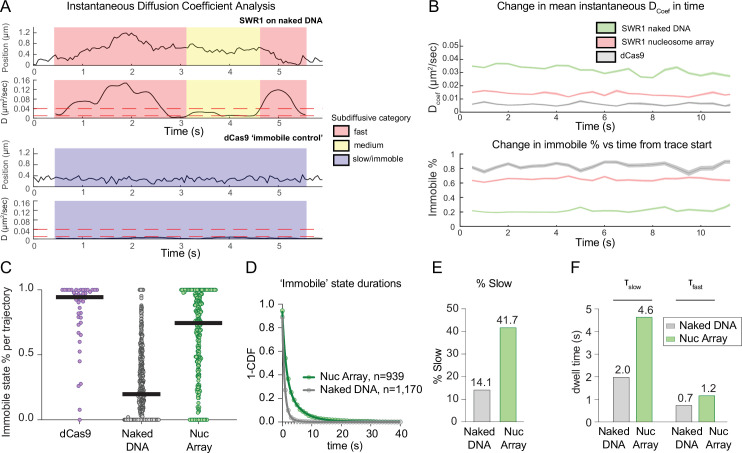
(A) Schematic of the experimental setup, with experimental question depicted therein. Note that diffusion is measured in the presence of 1 mM ATP and standard salt conditions (70 mM KCl). (B) Example force–distance curve showing that at 15 pN nucleosomes begin to unwrap. Vertical red line shows the length of the nucleosome array 5 pN. (C) Example unwrapping events that result in characteristic lengthening of 25 nm at this force regime. (D) Lambda nucleosome arrays extension (unwrapping) and retraction curves, with a reference naked DNA force–distance curves. Black curves are unwrapping curves where the force is clamped at either 20, 25, or 30 pN to visualize individual unwrapping events; red curves are the collapse of the DNA after unwrapping nucleosomes; green curves are reference force extension plots of lambda DNA without nucleosomes. (E) Histogram of the number of nucleosomes per array determined from the length of the array at 5 pN and the compaction ratio. (F) Mean squared displacements (MSDs) are fit over the first 2 s to MSD = Dtα, the red lines represent the fits with 95% confidence interval shown as dashed lines. SWR1 diffusing on naked DNA (green curve), on lambda nucleosome arrays (blue), and for comparison dCas9 (black). (G) Representative SWR1 particles diffusing on the nucleosome arrays are cropped and arranged by the length of the trace.


