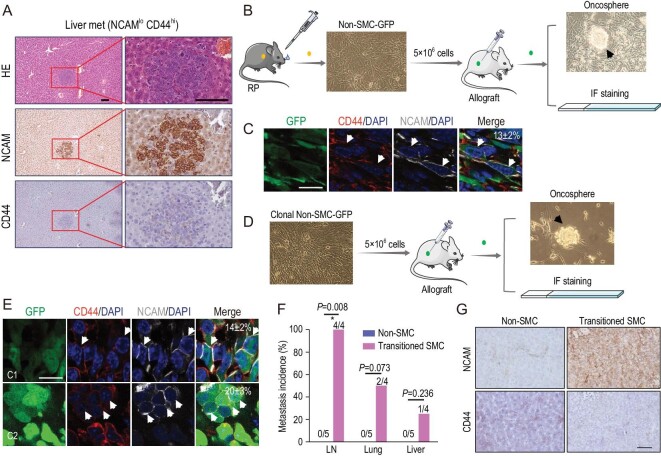
Figure 2.
Phenotypic transition from non-SMC to SMC contributes to SCLC metastasis. (A) Representative photos for HE staining, NCAM and CD44 IHC staining in the only liver metastasis from nude mice subcutaneously transplanted with the NCAMloCD44hi cell lines (non-SMC) derived from the RP mouse model. Scale bars, 100 μm. (B) Experimental scheme to test phenotypic transition from non-SMC to SMC. Primary non-SMC was derived from the RP mouse model and ectopically expressed GFP, and then used for subcutaneous transplantation in nude mice. The subcutaneous tumors were analyzed through oncosphere formation, and NCAM and CD44 IF staining. Oncospheres in cell culture were indicated. (C) Representative photos of NCAM and CD44 IF staining in subcutaneous tumors from nude mice transplanted with non-SMC-GFP cells. The NCAMhiCD44lo/– subpopulation indicated by white arrows were microscopically counted and the mean ratio of NCAMhiCD44lo/– cells is indicated in the top right corner. Scale bar, 25 μm. Data are shown as mean ± S.E.M. (D) Experimental scheme to test the potential phenotypic transition using single-cell-derived clonal non-SMC-GFP. The subcutaneous tumors were then analyzed through oncosphere formation and NCAM and CD44 IF staining. Oncospheres in cell culture were indicated. (E) Representative photos of NCAM and CD44 IF staining in clonal non-SMC-GFP subcutaneous tumors. C1: clone #1; C2: clone #2. The NCAMhiCD44lo/– subpopulation indicated by white arrows was microscopically counted and the ratio of NCAMhiCD44lo/– cells is indicated in the top right corner. Scale bar, 25 μm. Data are shown as mean ± S.E.M. (F) Statistical analyses of the incidence of lymph node (LN), lung and liver metastases in nude mice subcutaneously transplanted with transitioned SMC or non-SMC, which were derived from the clonal non-SMC-GFP subcutaneous tumors. n = 4 mice for transitioned SMC group and n = 5 mice for paired non-SMC group. P values were calculated by Pearson chi-square test. (G) Representative photos of NCAM and CD44 IHC staining of mouse livers in (F). The livers from paired non-SMC showed no metastasis. Scale bar, 100 μm.

