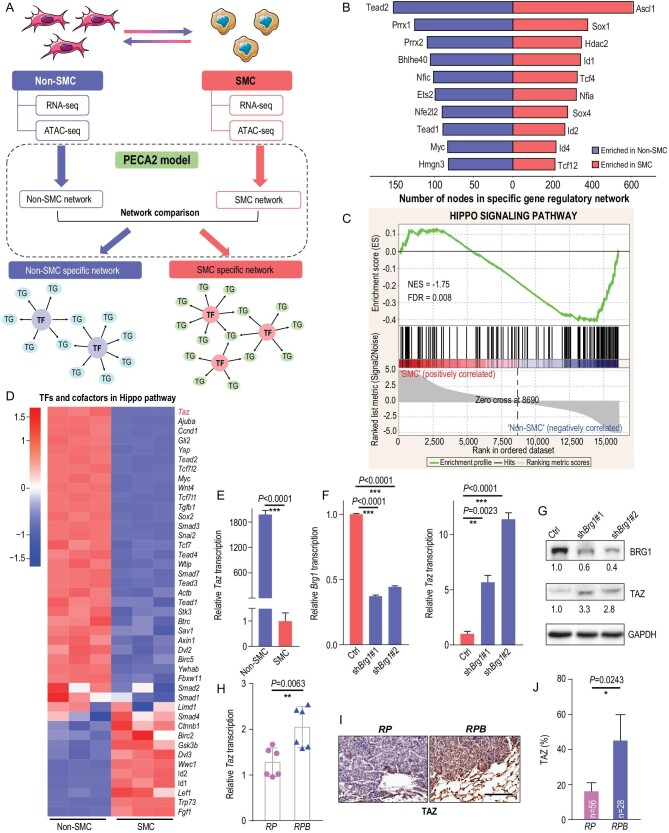
Figure 4.
TAZ is epigenetically silenced by the SWI/SNF complex in SMC. (A) Schematic illustration of the integrative analyses of RNA-seq and ATAC-seq in SMC and non-SMC. Specific TF networks in SMC and non-SMC were constructed according to the PECA2 model (see details in Materials and Methods). TG, target genes. (B) Enriched TFs in SMC and non-SMC through integrative analyses of ATAC-seq and RNA-seq data ranked according to the numbers of dysregulated target genes. (C) Gene set enrichment analysis (GSEA) plot of the Hippo signaling pathway in SMC vs. non-SMC. (D) Heat map of RNA-seq data showing the relative expression of TFs and cofactors in the Hippo pathway in SMC vs. non-SMC. (E) Real-time PCR detection of Taz in SMC and non-SMC. Data are shown as mean ± S.E.M. P value was calculated by unpaired two-tailed t test. (F) Real-time PCR detection of Brg1 and Taz in SMC with or without Brg1 knockdown. Gapdh served as the internal control. Data are shown as mean ± S.E.M. P values were calculated by unpaired two-tailed t test. (G) Western blot detection of BRG1 and TAZ levels in SMC with or without Brg1 knockdown. GAPDH served as the internal control. (H) Real-time PCR detection of Taz in primary tumors from RP and RPB mice at 32 weeks after Ad-Cre treatment. Gapdh served as the internal control. n = 2 for each group. Data are shown as mean ± S.E.M. P value was calculated by unpaired two-tailed t test. (I) Representative photos of TAZ IHC staining in primary tumors from RP and RPB mice at 32 weeks after Ad-Cre treatment. Scale bar, 100 μm. (J) Percentage of TAZ positive tumors in RP vs. RPB mice at 32 weeks after Ad-Cre treatment; 56 tumors from 3 RP mice and 28 tumors from 4 RPB mice were analyzed. Data are shown as mean ± S.E.M. P value was calculated by unpaired two-tailed t test.

