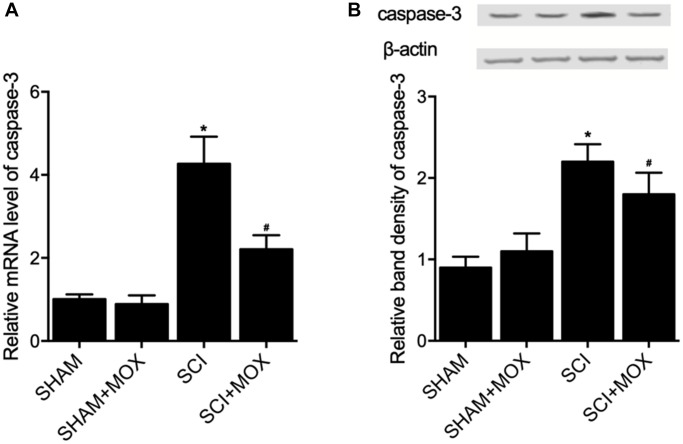
Figure 7.
MOX treatment suppressed SCI-induced up-regulation of caspase-3 expression in SCI mice (*P value < 0.05 vs. SHAM group; #P value < 0.05 vs. SCI group). (A) Relative mRNA level of caspase-3 in the SHAM group, SHAM+MOX group, SCI group and SCI+MOX group; (B) Relative band density of caspase-3 protein in the SHAM group, SHAM+MOX group, SCI group and SCI+MOX group.

