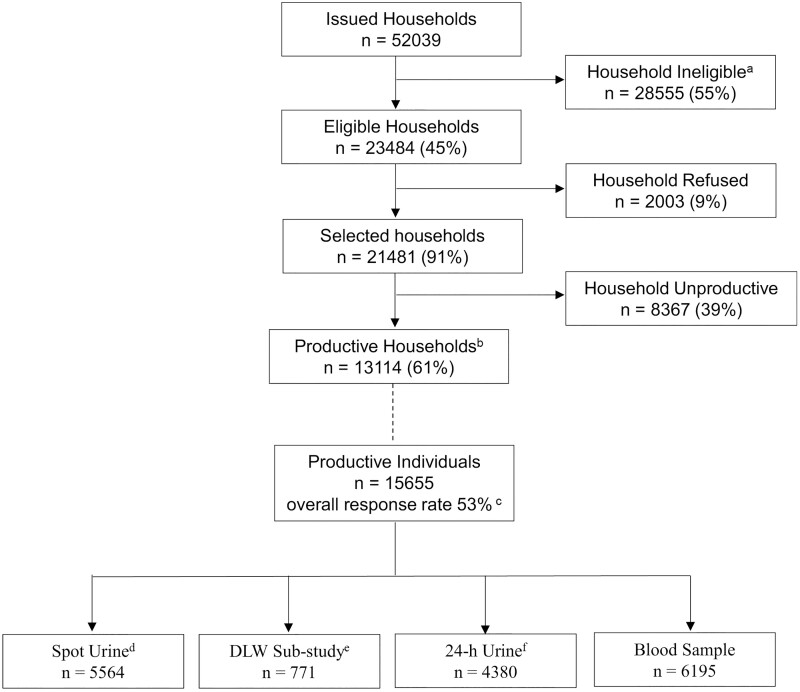
Figure 1.
Flow diagram of recruitment numbers and response rates for the UK National Diet and Nutrition Survey Rolling Programme Years 1–11, 2008–2019. DLW, doubly labelled water. aThe majority were addresses selected for the child boost sample that were screened out because they did not contain any children in the eligible age range (1.5 to 18 years). The remainder included vacant or derelict properties and institutions. bThose in which one or more participant(s) completed 3 or 4 diary days. cResponse is calculation of: the proportion of eligible addresses that are productive multiplied by the proportion of total individuals that are productive. Productive individuals are those that completed 3 or 4 diary days. dIncluded in Years 6 to 11 for participants aged 4 years and above only. eIncluded in Years 1, 3, 6 and 7 for participants aged 4 years and above only. fIncluded in Years 1 to 5 for participants aged 4 years and above only

