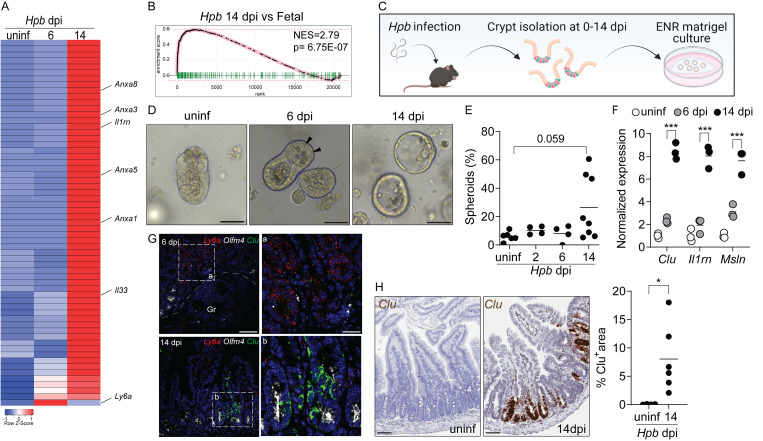
Figure 1.
A fetal-associated transcriptional signature at the luminal stage of Hpb infection. (A) Analysis of RNA-seq dataset (Gentile et al., 2020) showing reads per kilobase million of fetal-associated genes (Mustata et al., 2013) in duodenal tissue 6 and 14 dpi. Specific genes of interest are depicted by name. Heatmap was created using the Heatmapper web tool (Babicki et al., 2016); uninf, uninfected. (B) GSEA of fetal-associated transcripts 14 dpi (in comparison to Mustata et al., 2013). NES, normalized enrichment score. (C–E) C57BL/6 mice were infected with 150 L3 Hpb larvae, and SI crypts were extracted 2, 6, and 14 dpi and plated in Matrigel domes for 24–48 h. Image in C created with Biorender.com. (D) Representative photomicrographs of organoids cultured from Hpb-infected intestines, 24 h after culture time point; arrowheads indicate Paneth cells. (E) Frequency of organoids with spheroid morphology. (F) qPCR analysis of organoids cultured from Hpb-infected intestines. (G) RNAscope of fetal-associated transcripts in Hpb-infected tissue. a and b are enlarged insets from left panels; Gr, granuloma. (H) Colorimetric RNAscope of Clu mRNA and quantification of Clu+ areas. Scale bar, 50 μm (D–G); 100 μm (H). Data shown are representative of one (A and B) or two or more (D–H) independent experiments, n > 3 biological replicates. Statistical tests: nonparametric one-way ANOVA (E), t test (F and H); *, P < 0.05; ***, P < 0.005.

