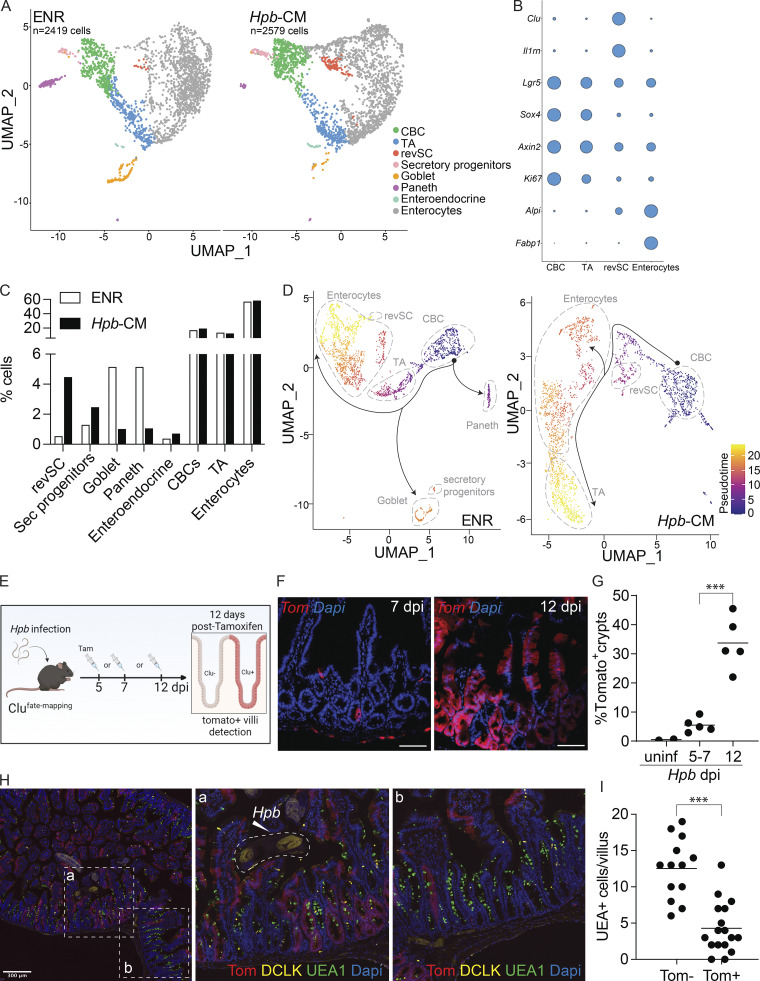
Figure 3.
Hpb-CM expands revSCs and limits secretory cell differentiation. SI organoids were stimulated with Hpb-CM for 24 h from the plating of fresh crypts, and scRNA-seq analysis was performed. (A) UMAP projection plots; colors represent cells clustered together based on gene expression similarity. (B) Representative cluster identifying markers; circle size represents average expression of indicated transcripts (complete gene expression list can be found in Table S2). (C) The proportion of each cluster within each sample is presented. (D) Trajectory analysis using CBCs as the pseudotime source variable (pseudotime = 0). (E–G) Clu fate-mapping (Clu-CreERT; Rosa26-LSL-tdTomato; Ayyaz et al., 2019) mice were infected with Hpb, and Clu+ Tom+ cells were labeled by tamoxifen injection 5, 7, or 12 dpi and imaged 12 d after each injection; scale bar, 100 μm; image created with Biorender.com. (H and I) Immunofluorescent staining for DCLK (yellow), UEA1 (green), and DAPI (blue) as well as detection of Tom (red) in Clu fate-mapping mice on 24 dpi (mice were injected with tamoxifen on 12 dpi). Data shown are representative of one (A–D) or three or more (E–I) independent experiments, n = 3–5 biological replicates. Statistical tests: two-way ANOVA (G), t test (I); ***, P < 0.005.

