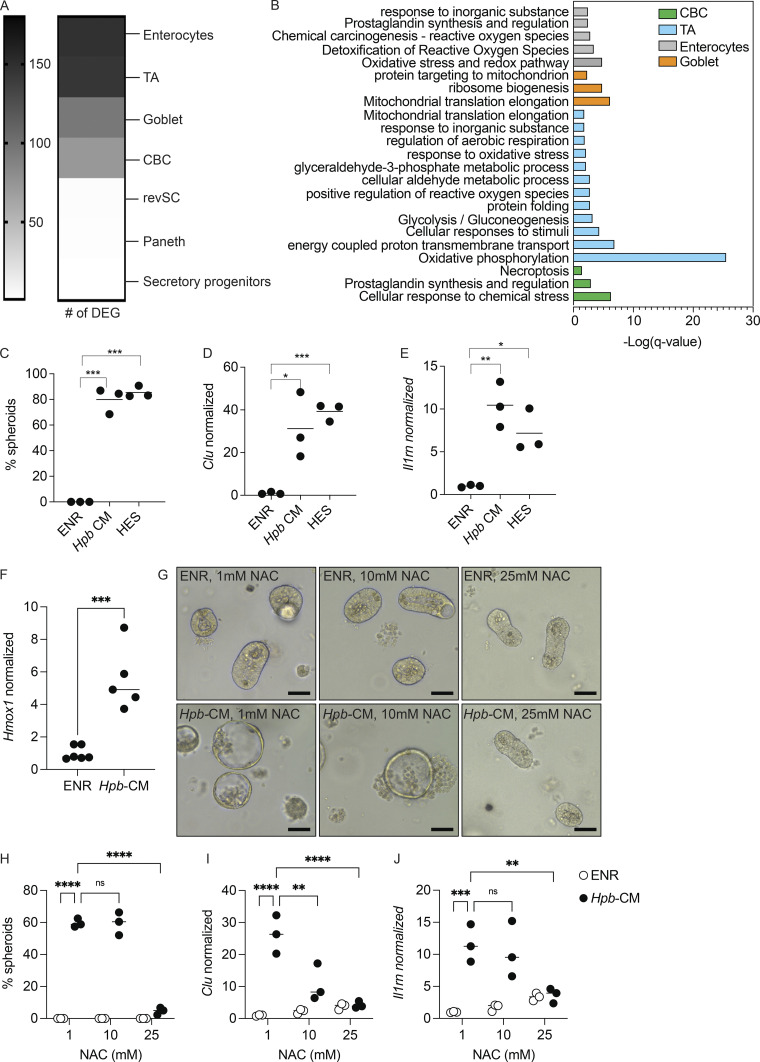
Figure 4.
An oxidative stress response drives Hpb-CM–induced fetal reversion of intestinal organoids. (A) Number of DEGs in each cell cluster identified by scRNA-seq analysis described in Fig. 3. (B) Pathway analysis based on DEGs was performed using Metascape (Zhou et al., 2019). (C–E) SI organoids were stimulated at the start of culture with ENR (control), Hpb-CM, or a 10-fold dilution of HES for 24 h. (C) Frequency of organoids with a spheroid morphology. (D and E) qPCR analysis of the indicated genes normalized to Hprt expression. (F–J) SI organoids were stimulated at the start of culture with ENR (control) or Hpb-CM. qPCR analysis is shown (G–J). SI organoids were stimulated with ENR (control) or Hpb-CM in the presence of increasing concentrations of NAC for 24 h. qPCR analysis of the indicated genes is shown. Scale bar, 50 μm; data shown are representative of one (A and B) or three or more (C–H) independent experiments, n = 3–5 biological replicates. Statistical tests: one-way ANOVA (C–E), t test (F), two-way ANOVA (H–J); *, P < 0.05; *, P < 0.01; ***, P < 0.005; ****, P < 0.001.

