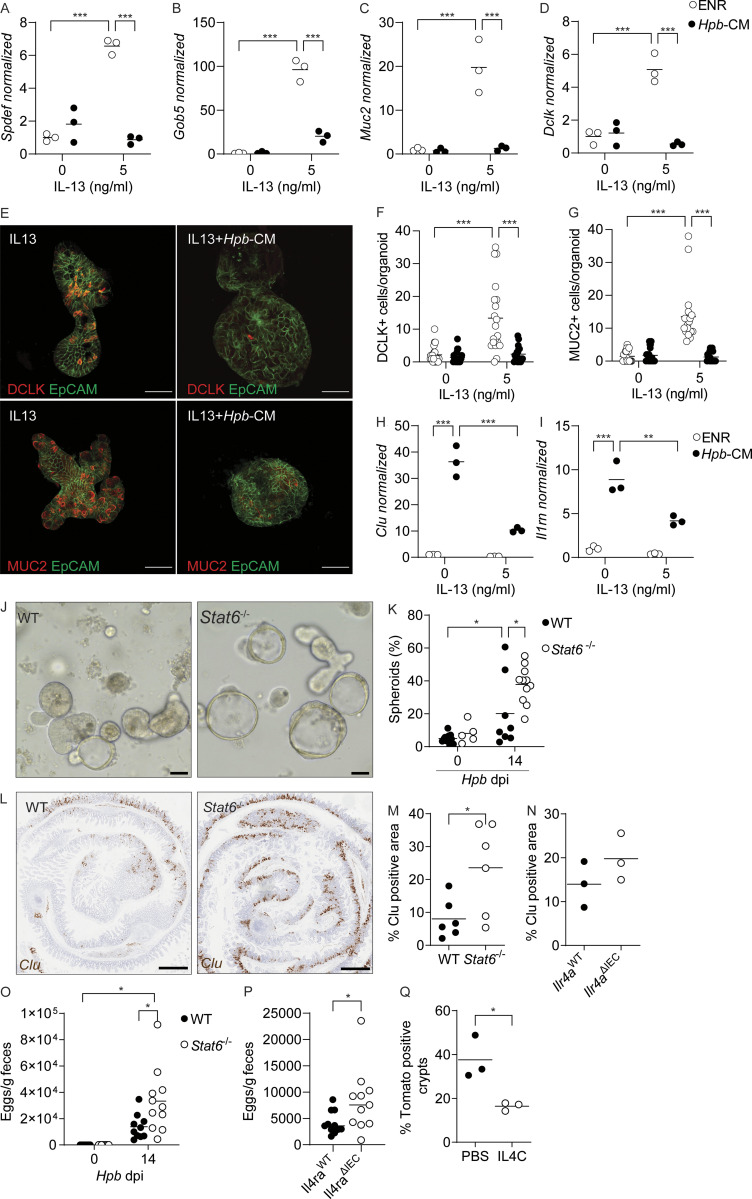
Figure 5.
Counter-regulation of the ISC compartment by helminths and type 2 cytokine signaling. (A–D) SI organoids were stimulated at the start of culture with Hpb-CM ± IL-13, and qPCR analysis was performed for the indicated genes 48 h later. (E) Photomicrographs of organoids stimulated with Hpb-CM ± IL-13 for 48 h. (F and G) DCLK+ (F) and MUC2+ (G) cells were counted in 20 individual organoids from two mice. (H and I) SI organoids were stimulated with IL-13 for 10 d (over three passages) before Hpb-CM stimulation, and qPCR analysis for the indicated genes was performed 24 h after Hpb-CM stimulation. (J and K) C57BL/6 and Stat6−/− mice were infected with Hpb, and crypts were extracted 14 dpi and plated in Matrigel domes for 24 h. Representative photomicrographs (J) and quantification of ex vivo spheroid generation (K) are shown. (L and M) Clu expression by in situ hybridization of WT and Stat6−/− tissues 14 dpi. Representative photomicrographs (L) and quantification (M) of Clu+ tissue area. (N) Quantification of Clu+ intestinal tissue from Il4raWT and Il4raΔIEC mice 14 dpi. (O and P) Fecal Hpb egg counts from WT and Stat6−/− (O) and Il4raWT and Il4raΔIEC (P) mice 14 dpi. (Q) Quantification of Clu+ intestinal area from Clu fate-mapping mice injected with tamoxifen 12 dpi and PBS or IL-4C 10, 12, and 14 dpi. Tissues were harvested on day 24 after infection. Scale bar, 50 μm (E and J); 1 mm (L). All data shown are representative of two or more independent experiments, n > 3 biological replicates. Statistical tests: two-way ANOVA (A–K and O), t test (M, N, and Q); *, P < 0.05; **, P < 0.01; ***, P < 0.005.

