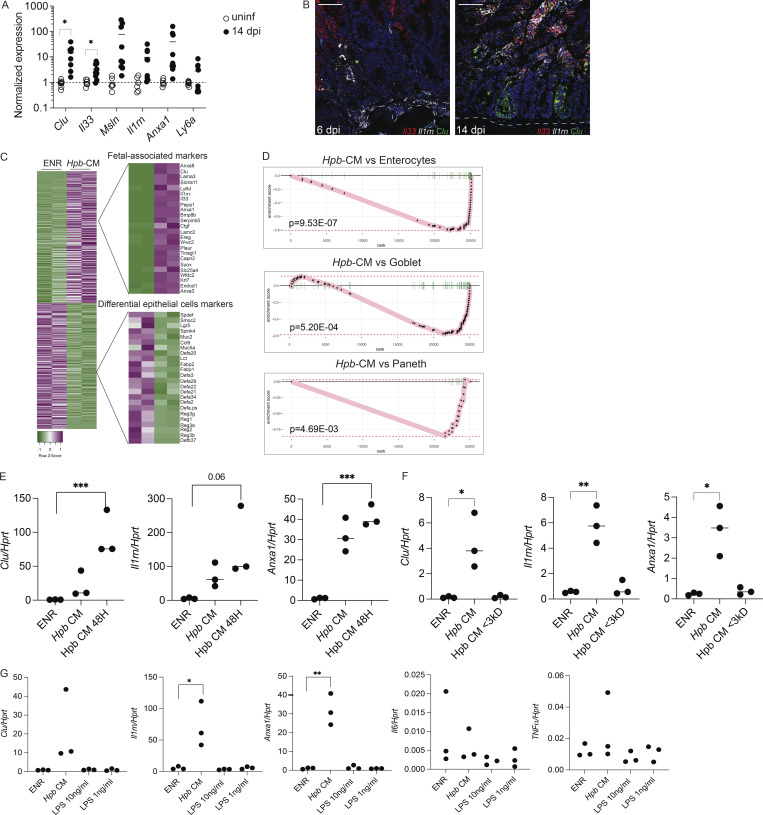
Figure S1.
Fetal reversion of the intestinal epithelium at the luminal stage of Hpb infection and following Hpb-CM stimulation of SI organoids. Related to Figs. 1 and 2. (A) Epithelial cells were extracted from the SI of uninfected mice on day 14 after Hpb infection, and expression of the indicated fetal genes was assessed by qPCR. (B) RNAscope of Il33, Il1rn, and Clu on days 6 and 14 after Hpb infection of SI tissues. (C) Heatmap of reads per kilobase million was created using the Heatmapper web tool (Babicki et al., 2016). (D) GSEA of transcripts associated with mature enterocytes, goblet cells, and Paneth cells following Hpb-CM stimulation of organoids. To exclude the possibility of endotoxin or host protein contamination in Hpb-CM, the following three experiments were performed: (E) Hpb adult worms were incubated in organoid basal medium. 24 h later, CM was collected (Hpb-CM), and the worms were moved into fresh organoid basal medium for an additional 24 h. At the 48-h time point, CM was collected again (Hpb-CM 48H). SI organoids were stimulated on day 0 of culture with Hpb-CM, Hpb-CM 48H, or control ENR medium. qPCR analysis of selected fetal-associated genes is shown. (F) Hpb-CM was passed through a 3-kD filter, and the flowthrough was collected. SI organoids were stimulated on day 0 of culture with crude Hpb-CM, flowthrough fraction of Hpb-CM (Hpb-CM <3 kD), or control ENR medium. (G) SI organoids were stimulated on day 0 of culture with Hpb-CM, 1 ng/ml LPS, 10 ng/ml LPS, or control ENR medium. qPCR analysis of selected fetal-associated genes as well as Il6 and Tnfa is shown. Scale bar, 50 μm. Data shown are representative of two independent experiments (A, B, and E–G) or one independent experiment (C and D), n > 3 biological replicates. Statistical tests: t test (A–G); *, P < 0.05; **, P < 0.01; ***, P < 0.005.

