Figure 5.
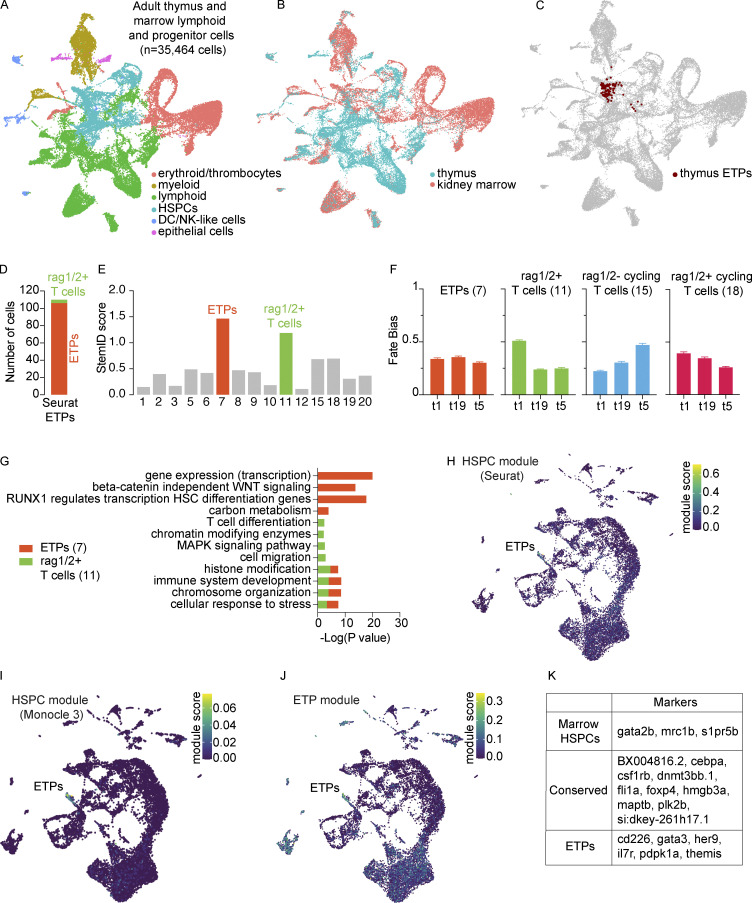
Identification and characterization of ETPs. (A and B) UMAP visualizations of the adult thymus and lymphoid and progenitor marrow fraction integrated together in Seurat (n = 35,464 cells) annotated by (A) cell lineage and (B) tissue of origin. These cells were derived from seven adult zebrafish dissected and processed in three independent experiments; paired marrow and thymi were obtained from two zebrafish. (C) UMAP visualization of Seurat ETPs (cluster 38, resolution = 3; Table S1) on the integrated adult thymus and lymphoid and progenitor marrow fraction UMAP. Highlighted cells fall predominately in the integrated HSPC cluster. (D) Assessment of the Seurat ETPs (cluster 38, resolution = 3) in RaceID3 analysis; the majority of Seurat ETPs were in RaceID3 cluster 7. (E) StemID score, the product of transcription entropy and number of inter-cluster links, displayed across all clusters; clusters 7 (ETPs) and 11 (rag1/2+ T cells) are highlighted in their respective cluster colors for having the highest StemID scores. (F) Fate bias probabilities within early clusters (highest StemID scores) across the three trajectories. Error bars depict SEM. (G) Enriched pathways determined using Metascape for the two earliest clusters (7 and 11) as predicted by FateID and StemID2. Negative log base 10 P values are plotted for a relevant subset of enriched pathways. (H–J) UMAP visualizations of gene modules in the adult thymus: (H) Seurat HSPC module (top 20 HSPC-enriched genes by specificity from Wilcoxon rank sum test), (I) Monocle 3 HSPC module, and (J) literature-based ETP gene module. See Materials and methods and Table S9 for module determination and the specific genes comprising each module, respectively. (K) Conserved and differentially expressed gene markers between thymic ETPs and marrow HSPCs as determined by Wilcoxon rank sum test (Tables S10 and S11). For the identification of conserved markers, P values were combined using Tippett’s method (minimum P value).

