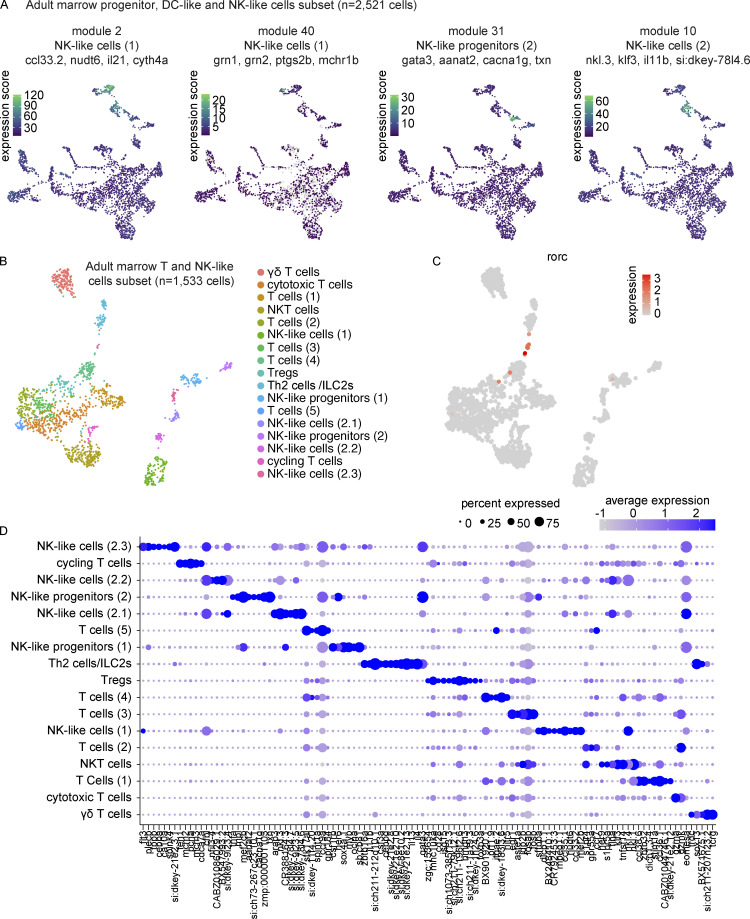
Figure 7.
Transcriptional characterization of marrow NK-like and T cell subpopulations. (A) UMAP visualizations of gene modules enriched across NK-like populations in the progenitor, DC-like cell, and NK-like cell marrow subset. (B) UMAP visualization of 1,533 T and NK-like cells as subsetted, re-integrated, and clustered from the larger marrow UMAP in Fig. 4 A. Cell type annotations were based on differential expression analysis as determined by Wilcoxon rank sum test in Seurat (Table S13). (C) UMAP visualization highlighting rorc+ T cells, too small a population to be resolved as an independent cluster, but nevertheless demonstrating clear heterogeneity. (D) Dot plot of selected markers differentially expressed across T and NK-like cell populations. Dot size reflects the percentage of cells within a population expressing a given marker and dot color shows the average expression within that population.

