Figure S2.
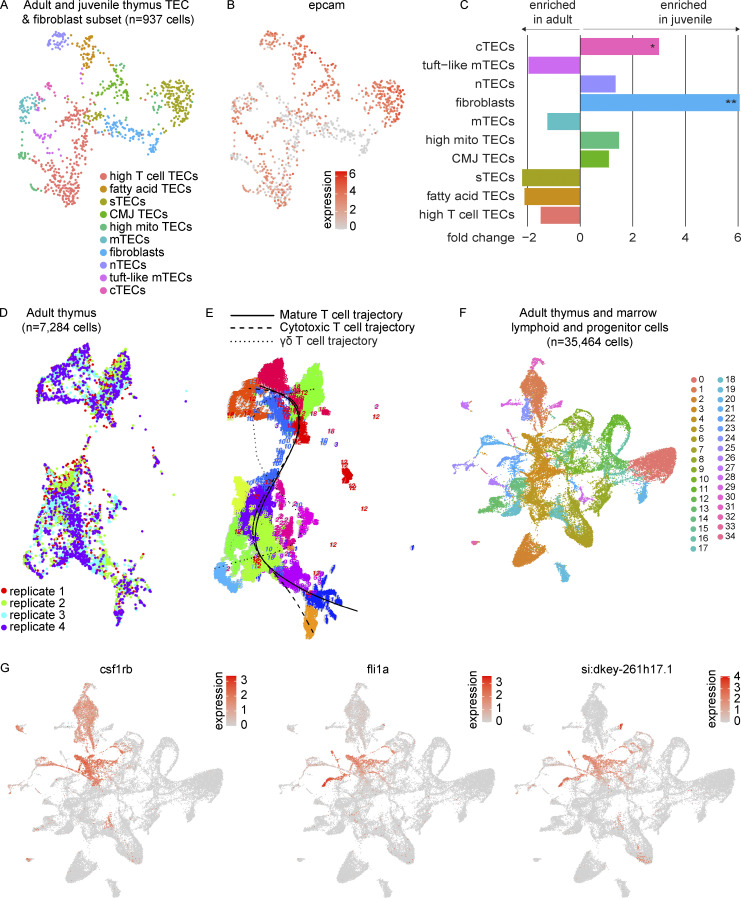
Zebrafish TECs and T cell developmental trajectories. (A) UMAP visualization of the 937 cells within the TEC and fibroblast populations of the combined adult and juvenile thymi as subsetted and re-analyzed to improve resolution of cell populations. Cell type annotations were based on differential expression analysis as determined by Wilcoxon rank sum test in Seurat (Table S5). (B) UMAP visualization of the expression of the epithelial marker, epcam, within the TEC and fibroblast subset. (C) Bar plot of beta-binomial test comparing composition of epithelial and fibroblast subset between juvenile and adult thymi (Table S6). Average fold change for each subpopulation is depicted by bar length and direction, with negative values enriched in the adult thymus and positive values enriched in the juvenile thymus. Statistical significance is shown for Benjamini-Hochberg adjusted P values: *, P < 0.05; **, P < 0.01. (D) UMAP visualization of RaceID3 clustering of cells derived from four adult thymi (n = 7,284 cells, independent analysis from Seurat) by replicate. (E) FateID principal curves fitted to mature T cell, cytotoxic T cell, and γδ T cell trajectories. (F) UMAP visualization of adult thymus and lymphoid and progenitor marrow fraction integrated together in Seurat (n = 35,464 cells) colored by cluster. These cells were derived from seven adult zebrafish dissected and processed in three independent experiments; paired marrow and thymi were obtained from two zebrafish as in Fig. 5, A–C. Cluster 4 is where the majority of thymus ETPs were highlighted in Fig. 5 C. (G) UMAP visualizations of marker genes used to identify the HSPC cluster (cluster 4). nTEC, neural TEC; mito, mitochondrial-gene expressing; CMJ, corticomedullary junction; sTEC, structural TEC.

