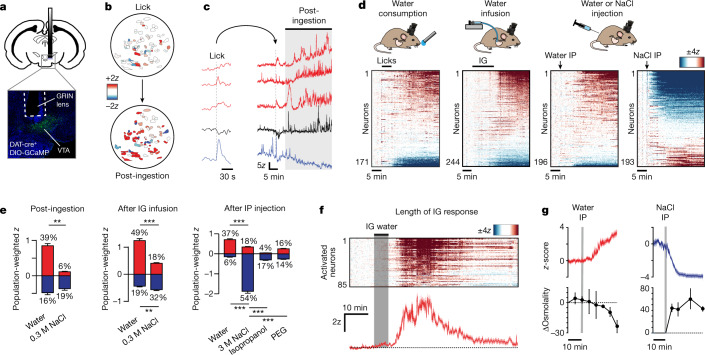
Fig. 1. VTA-DA neurons track systemic hydration.
a, Representative image of GRIN lens placement and VTA-DA neurons expressing GCaMP6. b, Tuning maps of DA neuron responses from the same field of view during and after drinking water. c, Example traces of calcium dynamics in five representative neurons during and after water consumption. d, Individual neuron responses to consumption of water, intragastric (IG) infusion of water (1.2 ml), and intraperitoneal (IP) injection of water (1.2 ml) or hypertonic saline (3 M NaCl, 0.12 ml). e, Population-weighted z-score (calculated as the fraction of neurons activated or inhibited multiplied by their z-scored activity change) for each of the stimuli shown. The percentages of neurons activated (red) and inhibited (blue) are listed above and below each bar graph. ‘Post-ingestion’ is from 0 to 20 min after the end of self-paced consumption of water or 0.3 M NaCl; ‘after IG infusion’ is from 0 to 20 min after the end of intragastric infusion (1.2 ml) of water or 0.3 M NaCl; ‘after IP injection’ is from 0 to 30 min after intraperitoneal injection of water (1.2 ml), NaCl (3 M, 0.12 ml), isoproterenol (100 mg kg−1) or polyethylene glycol (PEG) (40%, 0.4 ml). f, Top, time course of the activation and then return to baseline of individual VTA-DA neurons following intragastric infusion of water (1.2 ml). Bottom, mean trace. Mice are from a separate cohort than those used in d. g, Mean activity traces of neurons (from d) activated by intraperitoneal water injection (red) and inhibited by intraperitoneal NaCl injection (blue), with concurrent blood osmolality changes plotted below. NS, P > 0.05; **P < 0.01, ***P < 0.001. Data are mean ± s.e.m. Statistics are presented in Extended Data Table 2.

