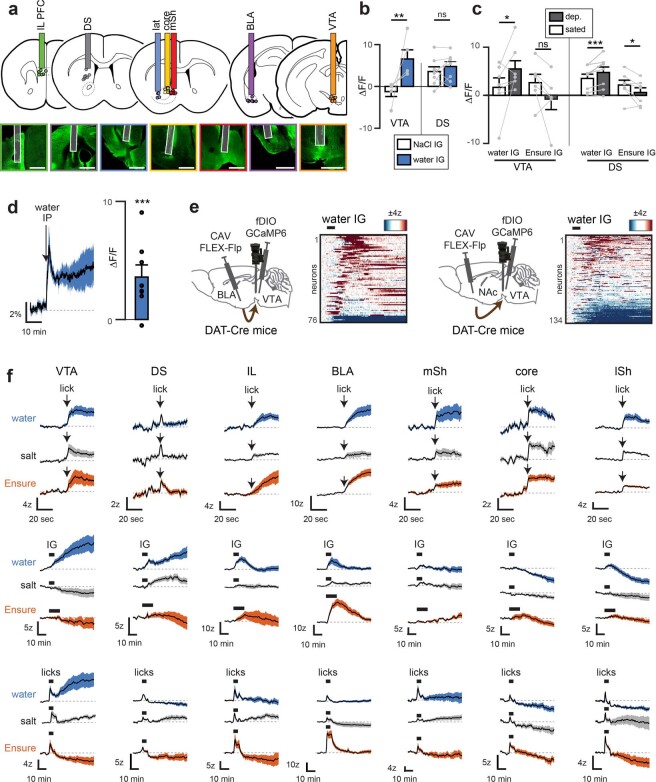
Extended Data Fig. 8. DA release in downstream targets in response to water, salt, and Ensure during different stages of ingestion.
a, Approximate placements (dots) of photometry fibers for GRAB-DA recordings, alongside representative images. Scale bar, 1 mm. b, GRAB-DA fluorescence responses in VTA and DS to systemic hydration changes following IG infusion (1.2 mL) of water or hypertonic saline (0.3 M NaCl). c, GRAB-DA responses in VTA and DS following IG infusion (1.2 mL) of water and Ensure during sated state and following food or water deprivation. d, Mean GRAB-DA responses in VTA during and after IP injection of water. e, Dynamics of BLA and NAc projection neurons during and after IG infusion of water (see Fig. 4e). f, Mean GRAB-DA responses during self-paced drinking (top and bottom rows) and IG infusion (1.2 mL, middle row) of water (blue), 300 mM NaCl (grey), and Ensure (orange). ns.P > 0.05, *P < 0.05, **P < 0.01, ***P < 0.001. All error bars and shaded lines show mean±s.e.m. Statistics in Extended Data Table 2, 3.

