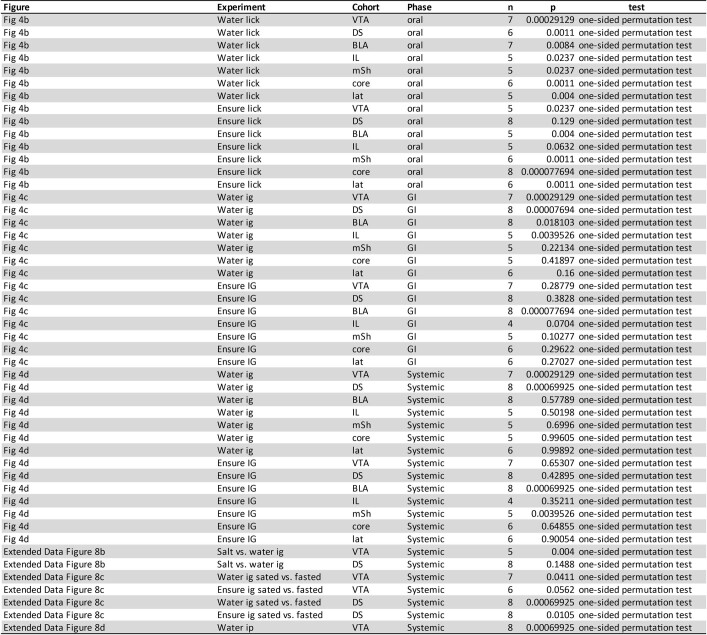
Extended Data Table 3.
Statistics for photometry data
Statistics are shown for each variable quantified during a given phase of an experiment in each figure. The number of mice (n) recorded in the experimental cohort are given alongside the p-value measured by the given statistical test. Cohorts of mice are separated by the brain area in which GRAB-DA signals were being recorded. The phase is the time window during which activity was quantified. The “oral” time window was defined as the 30 s immediately following the first licking bout. The “GI” time window was defined asthe 12 min immediately following the onset of IG infusion. The “Systemic” time window was defined as the time over which the infused, or injected solution would be absorbed into the blood (12–50 min after the onset of IG infusion or self-paced consumption, 0–30 min after intraperitoneal injection). Note that exact permutation tests were used, resulting in no arbitrary limitation on lowest p-value obtainable. One-sided permutation tests were used in Figs. 4b–d to determine which areas had increased dopamine release in each experiment. One-sided permutation tests were used in Extended Data Figs. 8b–d where effect direction could be predicted based on VTA-DA neuron recordings. For example, since VTA-DA neuron activation after water IG infusion was greater if the mouse was dehydrated beforehand (Extended Data Fig. 1q), dopamine release in VTA was expected to follow the same trend. No corrections were made for multiple comparisons.

