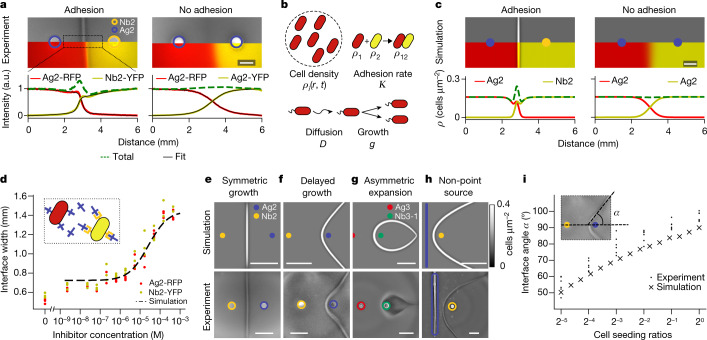
Fig. 2. Key interface properties can be rationally controlled in quantitative agreement with a biophysical continuum model.
a, Composite images of oblique transmitted illumination microscopy and fluorescent microscopy (top) and normalized quantification of fluorescence (bottom) show sharp and gradual interfacial transitions with adhesion (left) and without adhesion (right), respectively (for fit, see equation (1)). Note that colours of fluorophores (RFP, YFP) should not be confused with colour labels (blue, yellow) for two adhesins. Scale bar, 2 mm. b, The continuum model incorporates cell density, adhesion (leading to aggregation and immobilization), (active) diffusion and logistic population growth (equation S1). c, Model simulations recapitulate experiments and interface profiles from a (Supplementary Video S4). Scale bar, 2 mm. d, Interface widths can be experimentally tuned by adjusting adhesion avidity (K) using an adhesin inhibitor (EPEA10). e, Symmetric interfaces form when complementary strains have identical growth and motility properties. Scale bars, 5 mm. f, Interface angle and position can be tuned by delaying swarming initiation for one of the two colonies (experimentally, by using lower seeding density). Scale bars, 5 mm. g, Interface curvature and position can be tuned by using strains with different expansion rates (Supplementary Video S5). Scale bars, 5 mm. h, Non-point-source seeding generates interfaces consistent with the linear superposition of many point sources; for example, a line and a point generate the mathematically expected parabolic interface. Scale bars, 5 mm. i, Model and experiment agree for interface angle over a wide range of seeding densities (compare to f; see also Supplementary Fig. S2).

