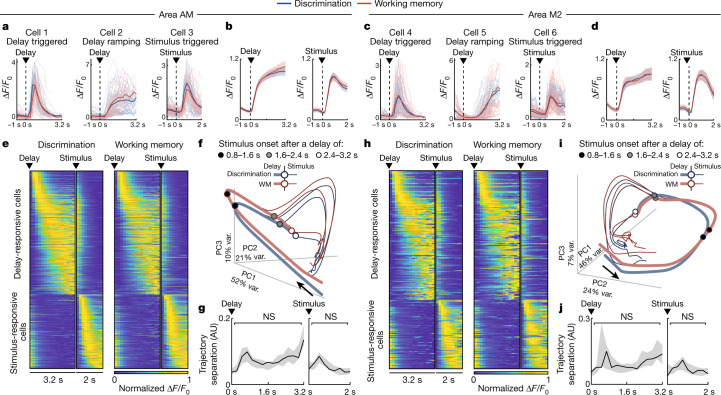
Fig. 2. Low-dimensional neural dynamics are independent of working memory.
a, Example single-cell responses in area AM. Saturated lines are mean responses during the Discrimination (blue) or WM (red) tasks. Dim lines are responses from 40 trials with the longest delay durations. The first two cells have their responses aligned to the delay onset, and the third cell to the stimulus. b, Cell- and trial-averaged responses (ΔF/F0) of the delay-responsive cells (left) and stimulus-responsive cells (right) in area AM (see Methods for selection criteria) to the delay and stimulus onsets, respectively, split by task. Cells pooled from all experiments (n = 16 from 7 mice). Shaded regions are 95% CI. c,d, As in a,b, for cells recorded in area M2 (n = 11 experiments from 7 mice). e, Single-cell responses for all delay-responsive and stimulus-responsive cells (individual rows) recorded in area AM (n = 16 experiments from 7 mice), averaged from Discrimination task (left) and WM task (right) trials, sorted by response latency (see Methods). Responses were normalized for each cell. f, Trial-averaged projections of area AM population activity (n = 5,589 cells pooled from 16 experiments) onto its first three PCs (see Methods). The proportion of variance (var.) explained is shown along each axis. Projections were split by task (colour) and into three groups of delay duration (0.8–1.6 s, 1.6–2.4 s and 2.4–3.2 s), such that activity was plotted from trials with delays that were at least as long as the respective stimulus onset time. Arrows represent the direction of time, circles represent the minimum stimulus onset of each delay duration group. Unsaturated lines represent activity preceding stimulus onset; saturated lines represent activity after stimulus onset. g, The Euclidean distance between Discrimination and WM task trajectories in f, averaged across experiments, is plotted over the course of the delay and stimulus (all time points P > α, Bonferroni-corrected α = 2.08 × 10⁻³, two-sided t-test). Shaded regions are 95% CI of a trial-shuffled null distribution of task trajectory distances. AU, arbitrary units. h–j, As in e–g, but for area M2. h, Delay- and stimulus-responsive cells pooled across n = 11 experiments from 7 mice. i,j, PCs calculated from n = 4,023 pooled active cells. j, All time points P > α, Bonferroni-corrected α = 2.08 × 10⁻³, two-sided t-test. NS, not significant.

