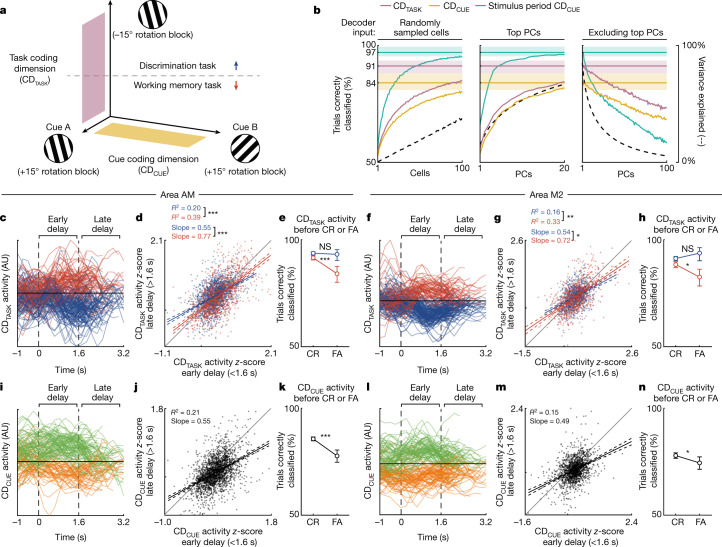
Fig. 3. High-dimensional embedding of working memory representations.
a, Schematic of two coding dimensions (CDTASK and CDCUE; see main text and Methods) used to identify working memory representations during the delay. CDTASK was identified from opposing rotation blocks for the two tasks, such that the preceding stimulus orientations were identical. b, Assessment of the embedding dimensionality of CDTASK (lilac), CDCUE (gold) and stimulus period CDCUE (see main text). Horizontal lines are mean test accuracies when decoding the task from CDTASK delay activity, the preceding cue from the CDCUE delay activity and the current cue from the stimulus period CDCUE stimulus-evoked activity (averages across n = 31 experiments; shaded regions are 95% CI; see Extended Data Fig. 7 for experiments split by area). Coloured incrementing lines are mean test accuracies when limiting the population activity available for decoding to a number of randomly sampled cells (left), the top PCs (centre) or excluding the top PCs (right). Dashed grey lines are the respective proportions of total population activity variance available for decoding. c, Single-trial population activity of an example experiment from area AM, aligned to the onset of the delay, projected onto CDTASK. Only trials with sufficiently long delays (≥2 s) are shown. d, z-scored single-trial area AM CDTASK activity in the second half (>1.6 s) of the delay plotted against the first half (<1.6 s) of the delay (that is, each point is one trial). Trials were split by task (colour) and the Discrimination task projections had their signs inverted. Only trials with sufficiently long delays (≥2 s) were included in this analysis (n = 2,921 trials collected from 18 experiments). Solid and dashed lines represent the fits and 95% CI of a regression model. The models’ coefficients of determination (R2) and slopes, and their differences between tasks, are shown (P = 2.40 × 10⁻⁵ and P = 3.08 × 10⁻⁴, respectively, difference greater than zero two-sided one-sample t-test). e, The proportion of cue trials in which CDTASK delay activity correctly classified the trials’ task, split by correct rejection (CR) or false alarm (FA) to the subsequent cue (P = 5.67 × 10⁻⁴, n = 3,577 trials for the WM task; P = 0.07, n = 5,781 trials for the Discrimination task; two-sided Fisher’s exact test). Error bars represent 95% CI. f–h, As in c–e, but for area M2 experiments. g, Differences between R2 values and slopes (n = 1,882 trials collected from 13 experiments; P = 6.05 × 10⁻³ and P = 4.64 × 10⁻², respectively, difference greater than zero two-sided one-sample t-test). h, Pre-CR and pre-FA difference (P = 1.71 × 10⁻², n = 2,573 trials for WM task; P = 0.47, n = 3,669 trials for Discrimination task; two-sided Fisher's exact test). i–k, As in c–e, but for CDCUE. j, n = 2,210 trials collected from 18 experiments. Cue A projections had their signs inverted. k, Pre-CR and pre-FA difference (P = 9.56 × 10⁻⁹, n = 6,816 trials, two-sided Fisher's exact test). l–n, As in i–k (CDCUE), but for area M2 experiments. m, n = 1,600 trials collected from 13 experiments. n, Pre-CR and pre-FA difference (P = 2.84 × 10⁻², n = 5,063 trials, two-sided Fisher's exact test). *P < 0.05, **P < 0.01, ***P < 0.001; NS, not significant.

