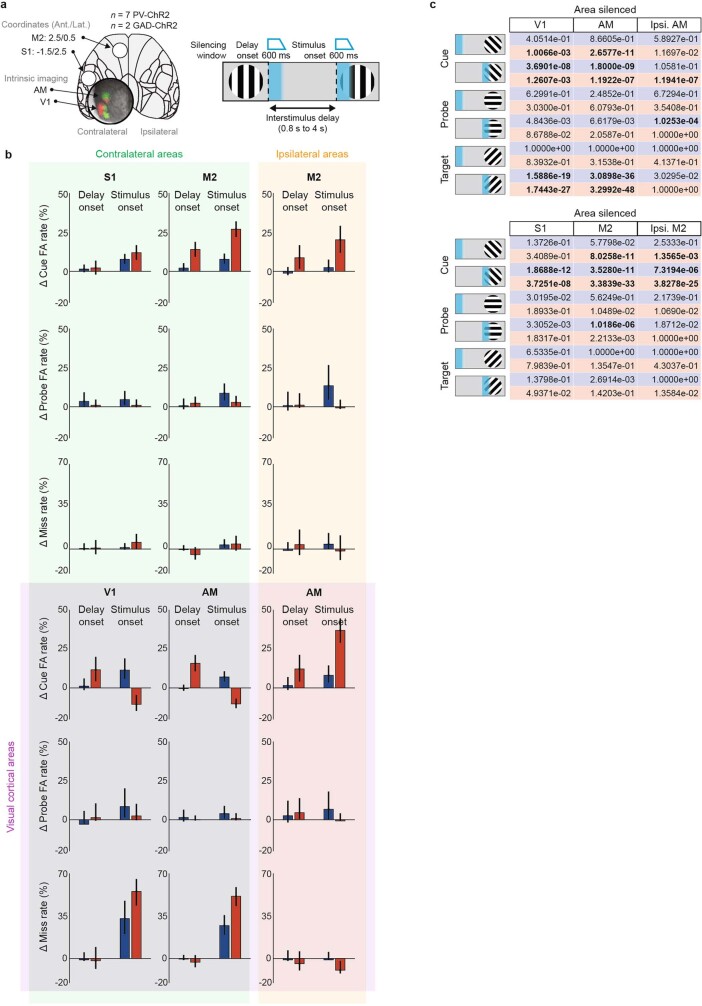
Extended Data Fig. 4. Optogenetic silencing effects.
a, Schematic of the optogenetic silencing design, as in Fig. 1g. b, Average optogenetic silencing effect on responses to cues (FAs), probes (FAs), and targets (hits) for all areas silenced (labels), during both tasks (Discrimination, blue, and WM, red), and for the two silencing onsets (at the onset of the delay, left, and at the onset of the stimulus, right). Individual bars represent the differences in mean FA or miss rate between silenced and control trials (n = 173,432, pooled from all 9 mice). Error bars represent 95% CI of silencing trials. Shaded background regions group the areas silenced into contralateral, ipsilateral, and visual cortical areas. c, Statistical significance of optogenetic silencing effects (p values) for each effect shown in b, two-sided Fisher’s exact test, with statistically significant effects in bold font. Significance thresholds were adjusted for multiple comparisons (36 comparisons, Bonferroni correction, α = 0.0014).

