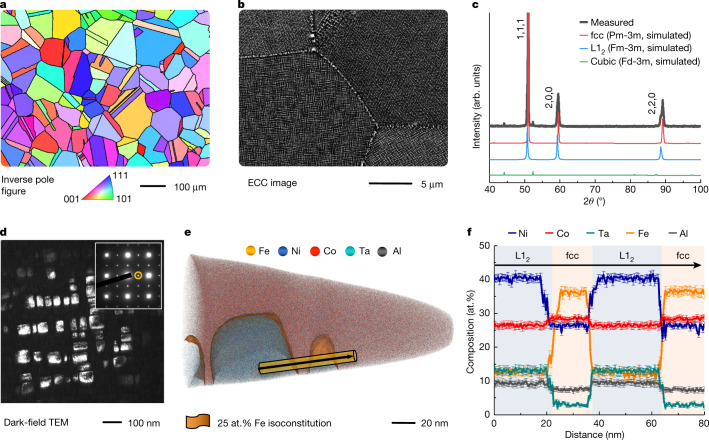
Fig. 1. Microstructure and chemical composition of the M-MCA.
a, EBSD inverse pole figure map showing the equiaxed grains of the fcc matrix. The black lines highlight the high-angle grain/twin boundaries. b, ECC image featuring the high-density uniformly distributed L12 particles in the grain interiors and heterogeneous particles at the grain boundaries. c, Measured and simulated XRD patterns showing the phase structures. d, Centred DF-TEM image of the L12 particles obtained using the (011) superlattice spot (see inset). e, 3D reconstruction map of a typical APT tip showing the cuboidal L12 particles embedded in the fcc matrix. The L12–fcc interfaces are highlighted using isocomposition surfaces containing 25 at.% Fe. f, 1D compositional profiles computed along the cylinder region in e (marked by the black arrow), showing the compositional changes across several interfaces. Error bars refer to the standard deviations of the counting statistics in each bin of the profiles.

