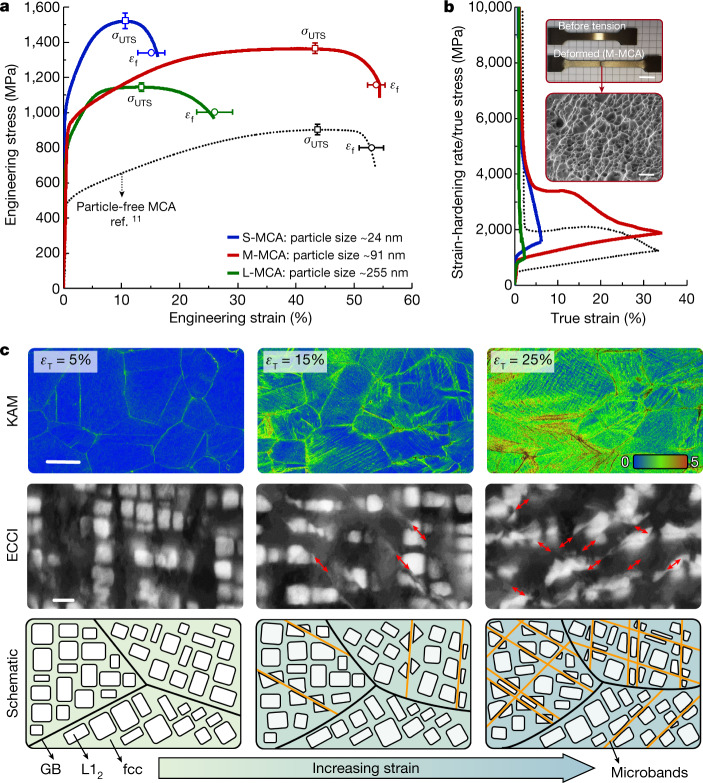
Fig. 2. Mechanical behaviour and nanoscale processes during plastic straining of the M-MCA.
a, Typical engineering stress–strain curves measured at room temperature, together with the average values for ultimate tensile strength (σUTS) and elongation at fracture (εf). b, Strain-hardening rate/true stress–true strain curves. The insets show the macroscopic image (top inset; scale bar, 1 cm) of the tensile sample and the corresponding fracture morphology (bottom inset; scale bar, 5 μm), in which a typical ductile fracture with fine dimples is observed. c, Substructure evolution as a function of global strain observed after interrupted tensile tests: EBSD-KAM maps showing the distributions of deformation-induced misorientations (top images; scale bar, 50 μm), in which εT stands for the global true strain; ECCI analysis (middle images; scale bar, 100 nm) showing the evolution of microbands; the shearing of L12 particles is highlighted by red arrows; schematics (bottom images) illustrating the microband refinement in the M-MCA during plastic straining.

