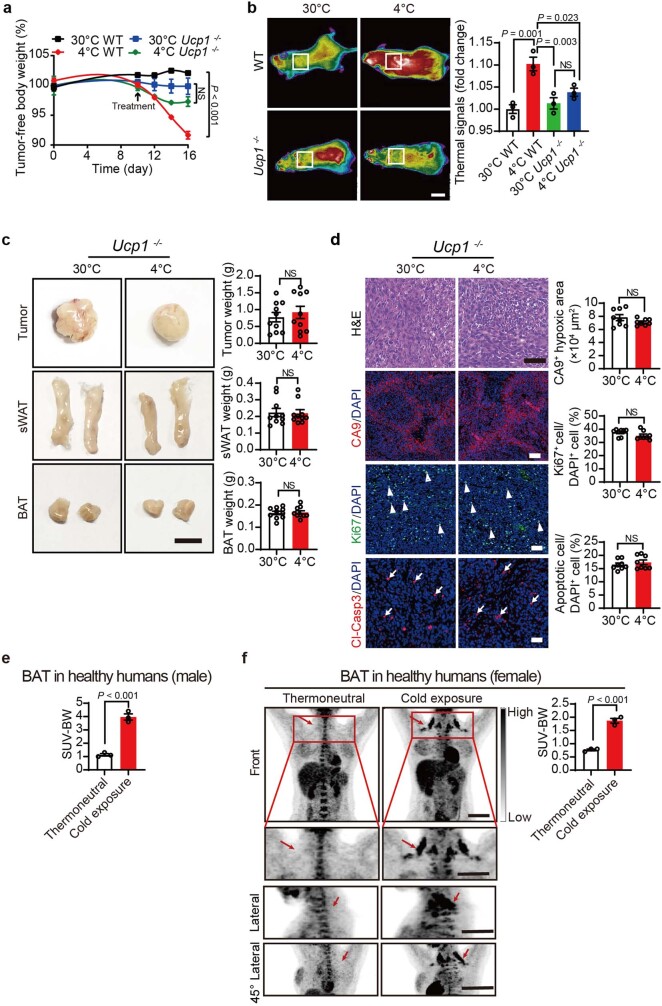
Extended Data Fig. 7. The impacts of UCP1 deletion in tumour microenvironment and the activation of BAT in healthy humans.
a, Tumour-free bodyweights of CRC tumour-bearing WT and Ucp1−/− mice under 30 °C and 4 °C (n = 6 mice per group). b, Images of infrared thermography from anaesthetized WT and Ucp1−/− mice under 30 °C and 4 °C. Box points to BAT approximate location. Scale bar, 1 cm. Quantification of interscapular thermal signals of WT and Ucp1−/− mice under 30 °C and 4 °C (n = 3 mice per group). c, Morphology and weight of CRC tumours, sWAT, and BAT of tumour-bearing Ucp1−/− mice under 30 °C or 4 °C (n = 10 samples per group). Scale bar, 0.5 cm. d, Histological staining, immunofluorescence staining, and quantifications of CA9+ hypoxic area, Ki-67+ proliferating cells, and Cl-Casp3+ apoptotic cells in CRC tumour-bearing Ucp1−/− mice under 30 °C and 4 °C (n = 8 random fields per group). Arrows and arrowheads point to positive signals. Scale bars, 50 μm. e, Quantification of 18F-FDG uptake in healthy male volunteers under thermoneutral (28 °C) and mild cold (16 °C) exposure for 2 weeks (n = 3 individuals). f, Representative PET images of 18F-FDG uptake by PET in healthy female volunteers under thermoneutral (28 °C) and mild cold (16 °C) exposure for 2 weeks. Scale bars, 100 mm. Quantification of SUV-BW positive signals presented in panel f (n = 3 individuals). Data presented as mean ± s.e.m. Statistical analysis was performed using one-way ANOVA followed by Tukey multiple tests (a, b) or two-sided unpaired t-test (c-f). NS, not significant.

