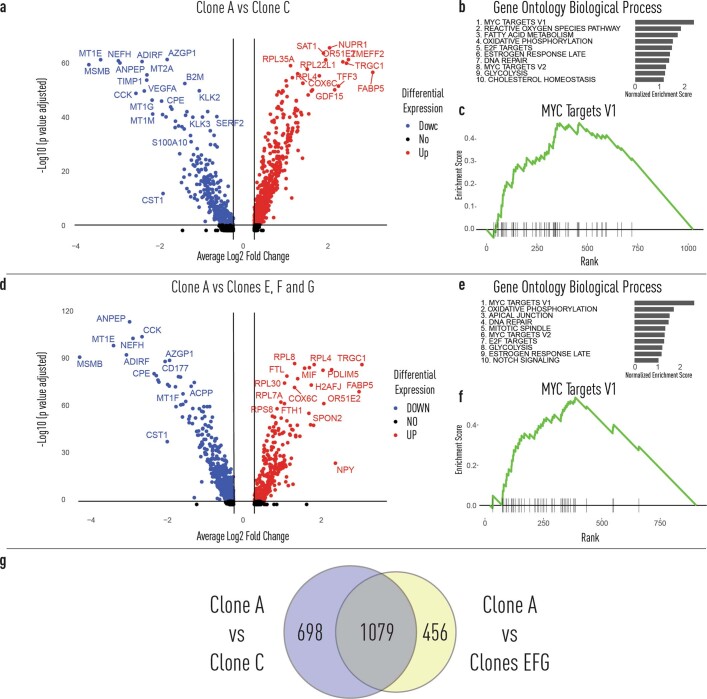
Extended Data Fig. 8. Differential gene expression analyses benign, altered benign and tumour clones.
a, Differentially expressed genes from benign clone A and altered clone C. Using a two-sided Wilcoxon Rank-Sum test. b, Top 10 pathways identified by geneset enrichment analyses (GSEA) from clone A vs clone C. c, Top ranked enrichment pathway from GSEA. d, Differentially expressed genes from benign clone A and tumour clones E, F and G. Using a two-sided Wilcoxon Rank-Sum test. e, Top 10 pathways identified by GSEA from clone A vs clones E, F and G. f, Top ranked enrichment pathway from GSEA. g, Venn-Diagram of genes from differential gene expression analyses identified only in benign clone A vs altered benign clone C analysis (left), benign clone A vs tumour clones E, F and G (right).

