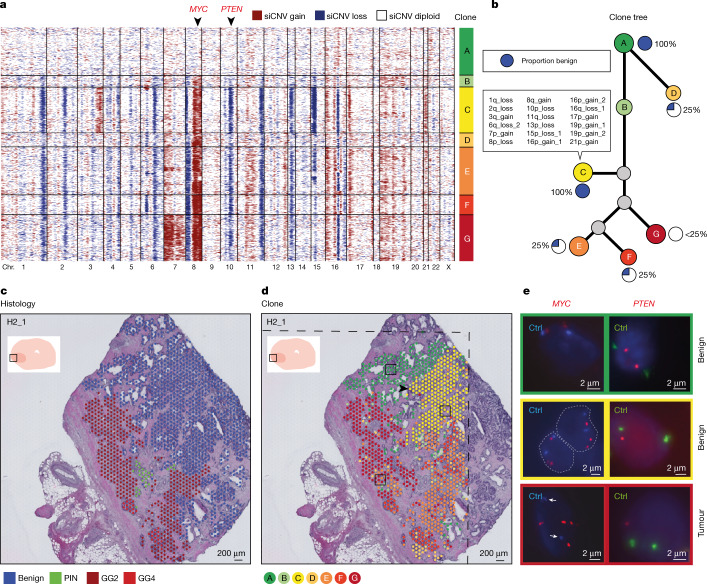
Fig. 3. Somatic events in both cancer and benign prostate epithelium.
a, Genome-wide derived CNV analysis (siCNVs) for each barcoded high-resolution spatial transcriptomic spot from section H2_1, which contained a mixture of tumour and benign epithelia (red, gain; blue, loss). Clonal groupings of spots (approximately 10–15 cells each) were determined by hierarchical clustering. On the basis of SNV analysis (Extended Data Fig. 7), clone A probably represents a polyclonal population of diploid cells. b, Phylogenetic clone tree of all clones from a. The proportion of benign epithelial cells in each clone was as indicated. Specific CNV locations unique to clone C are listed (summarized by the number of the chromosome where the event was located, p/q arm and gain/loss; the remainder of siCNV changes are given in Supplementary Table 2). c, Spatial visualization of the histopathological status of each spot. Each spot was assessed by two pathologists for consensus annotation, with only spots with >50% cellularity included. d, Spatial visualization of the clone status of each spot. Clonal groupings cross histological boundaries. The branching point of the prostatic duct (arrowhead) represents a possible site of somatic events arising in clone C (see also Extended Data Fig. 6). The dashed lines mark areas where no spatial transcriptomics data were obtained owing to the region being outside of barcoded array surfaces. e, FISH validation of two siCNVs: MYC, from chromosome 8q, and PTEN, from chromosome 10p (arrowheads in a). Control probes (Ctrl) targeted centromeres for chromosomes 8 and 10, respectively. All FISH panels depict single cells with one exception, where dashed grey lines highlight the nucleus borders and the presence of two cells. White arrows indicate the location of centromere controls.

