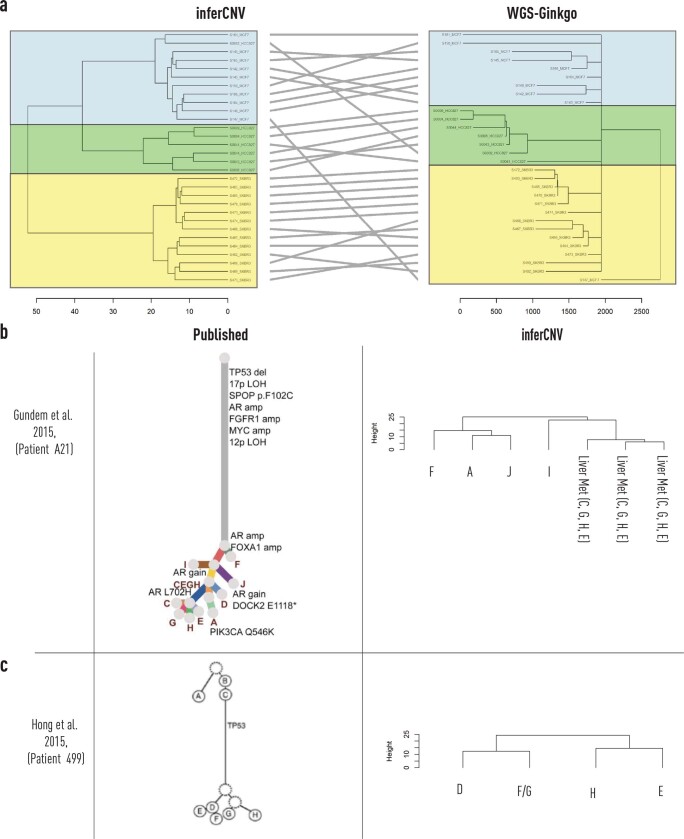
Extended Data Fig. 1. Comparison of phylograms created from whole genome sequencing CNVs and iCNV’s.
a, Comparison of single tumour cells with co-isolated DNA and RNA (Han et al., Genome Res 2018). Colours correspond to individual cell lines (yellow: SKBR3, green: HCC827, and light blue: MCF7). Entanglement of the phylograms was 0.11 (an entanglement value of 1 corresponds with full entanglement of two phylograms, whereas an entanglement value of 0 corresponds with no entanglement). b Phylogeny from patient A21, as published and reproduced from Gundem et al., Nature, 2015. Transcript data were available only for a subset of specimens. c, Phylogeny from patient 499, as published and reproduced from Hong et al., Nat. Comms, 2015. Transcript data available for a subset of specimens (used to reproduce phylogenetic tree by inferCNV).

