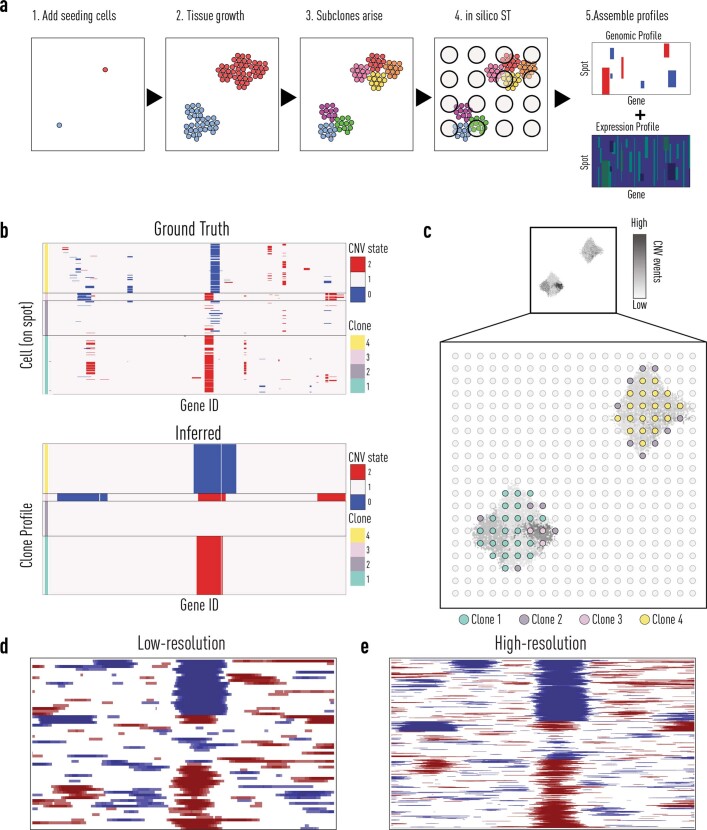
Extended Data Fig. 2. Generating and running inferCNV on synthetic data.
a, Schematic overview of the generative process used to produce artificial spatial data. 1) First a set of seeding cells (red and blue circles) are placed in a defined tissue domain (square), every seeding cell hosts one unique copy number event. 2) The cells are allowed to “grow” within the tissue domain until the number of cells in the domain exceeds a predetermined number. 3) Mutations in the genome occur stochastically during growth and as a result, subpopulations (indicated by colour) of cells with similar genomic profiles arise. 4) Unoccupied space in the tissue domain is filled with benign cells (no copy number variations), spatial capture locations are placed in a grid over the grown tissue and transcripts are “captured” from the cells overlying each spot. 5) Synthetic spatial expression data is produced together with associated ground truth genomic data (both on spot and cell level). b, Results from applying siCNV (bottom) to a set of synthetic data together with ground truth information (top), only cells residing at spots being annotated as non-benign are shown. Blue indicates a deletion event while red indicates an amplification event. The ground truth shows the genomic profiles for all cells contributing to the spots assigned to a given clone. Comparing the inferred state with the ground truth on a clone 19 level, the average accuracy across genes was 0.90 (standard deviation 0.10) c, Spatial organization of the synthetic data analysed in (b), with thumbnail of the complete cell population in the artificial tissue, each pixel corresponding to a cell. The cells’ intensity levels are proportional to their total number of associated copy number events. Circles represent the spots used to “capture” transcripts. Spots are coloured by their inferred clone identity. Note how Clone 2, predicted to have zero copy number events, is found along the borders of both foci, where there’s a mixture of benign and non-benign cells. d, siCNV outputs from simulated synthetic data of spots simulating ST 1k array (low-resolution) with 100 μm spot diameter and centre-to-centre distance of 200 μm. e, Visium (high-resolution). High resolution spots were 0.55x size of low resolution and had 5x more spots per area. The synthetic ground truth data were identical for both.

