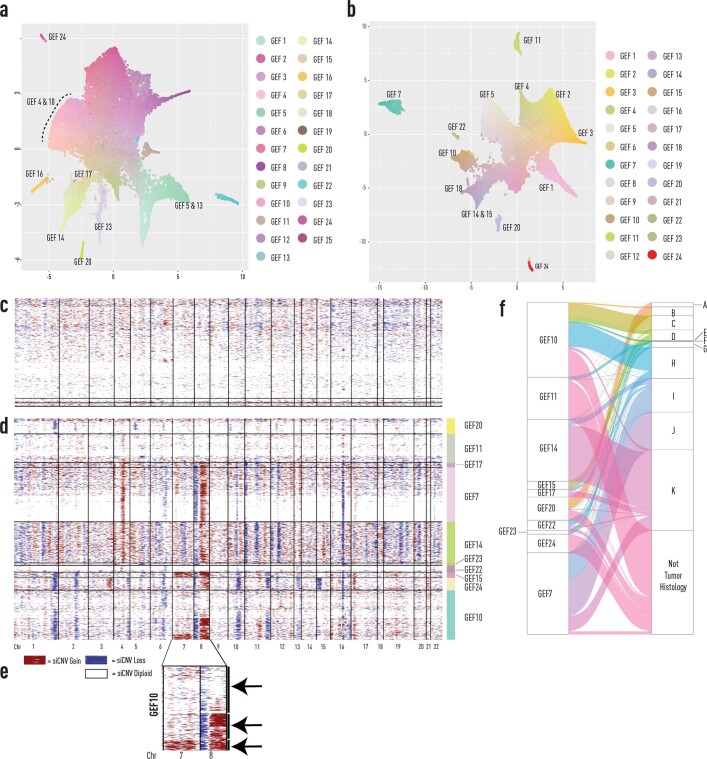
Extended Data Fig. 3. GEF directed inferCNV analysis from prostate patient 1 (high resolution Visium analysis).
a, UMAP summary of GEFs from 1k spatial transcriptomics experiments of prostate samples from patient 1. b, UMAP summary of GEFs from high resolution Visium experiments of prostate samples from patient 1. Top marker genes for each GEF are available in Supplementary Table 3, 4. c, Benign GEFs from b (high resolution) were used as a reference set for analysis of d, Tumour GEFS from b (high resolution). e, Snapshot of inferCNV profiles for chr 7 and 8 from GEF10. GEF inferCNV heterogeneity is highlighted by 3 subclones: the first harbouring no changes to chr 7 and 8, the second having a deletion and amplification in chr 8, and the last having alterations in both chr 7 and chr 8. While further subclustering of GEF10 spots using gene expression factors improved GEF to clone concordance, GEF to clone heterogeneity remained. f, Tumor GEFs distribution by siCNV clones (Fig. 2). GEF = Gene Expression Factor, chr = Chromosome, siCNV = spatial inferCNV.

