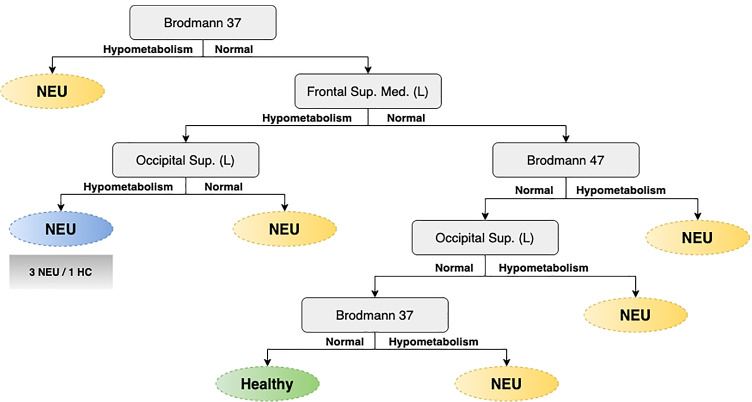
Fig. 12.
Decision trees corresponding to the classification problem NEU (AD or bvFTD) vs HC is presented as an example of a more interpretable graph. (Performance: Acc = 0.885 ± 0.04;Pre = 0.919 ± 0.03;Rec = 0.924 ± 0.04;F1 = 0.921 ± 0.03). Squares and ellipses represent nodes and leaves, respectively. The color blue denotes that most instances belong to the class indicated on the leaf but at least 1/4 correspond to the opposite class

