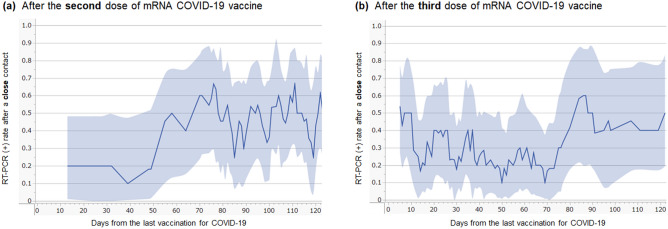
Figure 2.
RT-PCR test-positive rate after close contact with COVID-19 cases by the time of the last vaccination. Line graphs for the RT-PCR test-positive rate after close contact with COVID-19 cases, according to the days of the last vaccination in those who completed two (a) or three (b) doses of mRNA COVID-19 vaccines are shown. The lines represent the rolling average of the test-positive rate within the nearby ± 5 days for each day relapsed from the last vaccination. The blue-filled areas above and below the line graphs represent the 95% confidence interval of the test-positive rate. COVID-19, coronavirus disease 2019; mRNA, messenger RNA; RT-PCR, reverse transcription-polymerase chain reaction.

