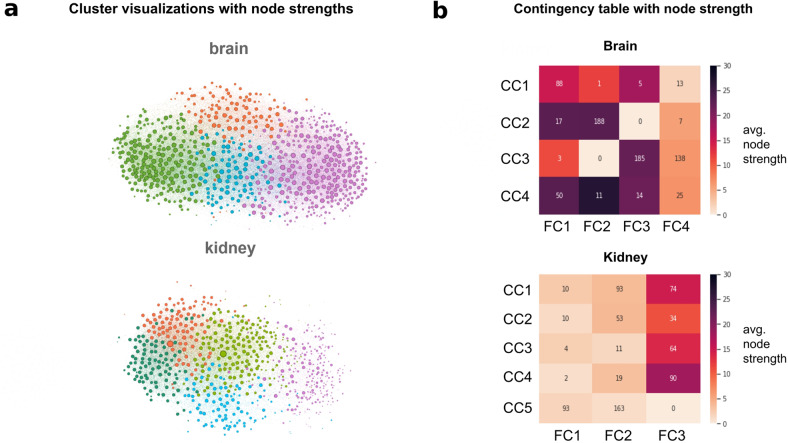
Fig. 2. SFARI genes define core clusters.
a Visualization of the core gene clusters. Colors correspond to the different clusters; nodes are sized based on their node strengths. b Contingency tables that provide the basis for Cramers’ V calculation. Numbers in cells of the table indicate the number of intersecting genes between clusters of the subgraph (CC, rows) and the full network (FC, columns). Colormaps are based on each subcluster’s average node strength to further demonstrate the centrality differences between the two tissues.

