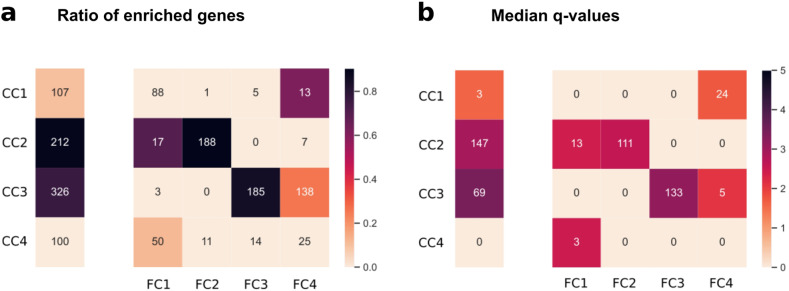
Fig. 5. Functional enrichments show that subclusters on brain tissue keep their functional comprehensibility.
The separate vertical vectors illustrate exclusively the core clusters, while the rows and columns of the contingency tables determine the intersections of core and full clusters, respectively. Numbers in the cells of the vectors and the tables represent a the number of genes and b the number of associated GO terms of core clusters and the subclusters., respectively. Colormaps show a the ratio of genes that are enriched (enriched/total genes in the cell) and b median of the –log(q) values associated with the enriched GO terms in the cell.

