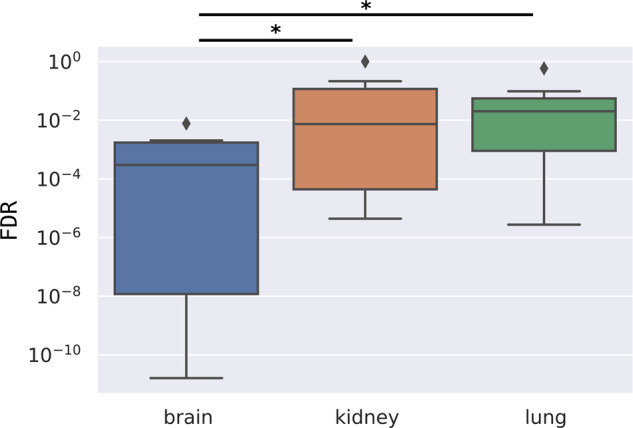
Fig. 7. Autism-related GO terms enriched more significantly in the brain subclusters than in kidney and lung.

Q-values (FDR) of the autism-related GO terms are presented on the box plot; brain with a blue, kidney with a red, and lung with a green box (centerline, median; box limits, upper and lower quartiles; whiskers, 1.5x interquartile range; diamonds, outliers). Statistical test: Mann–Whitney U test, significant differences are marked by *(p < 0.05).
