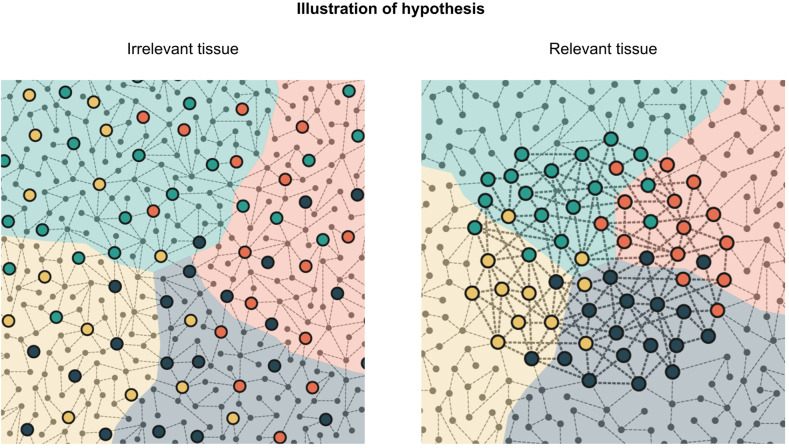
Fig. 8. Graphical illustration of the omnigenic theory-inspired clustering.
Background colors represent clusters of the entire graph, referred in the text as full clusters. Highlighted nodes are core genes with direct effect. Colors of highlighted nodes indicate cluster assignments on the core subgraph. On an irrelevant tissue, core genes are more scattered with weaker connections to each other. On relevant tissues, core clusters are stronger and overlap with the full clusters.

