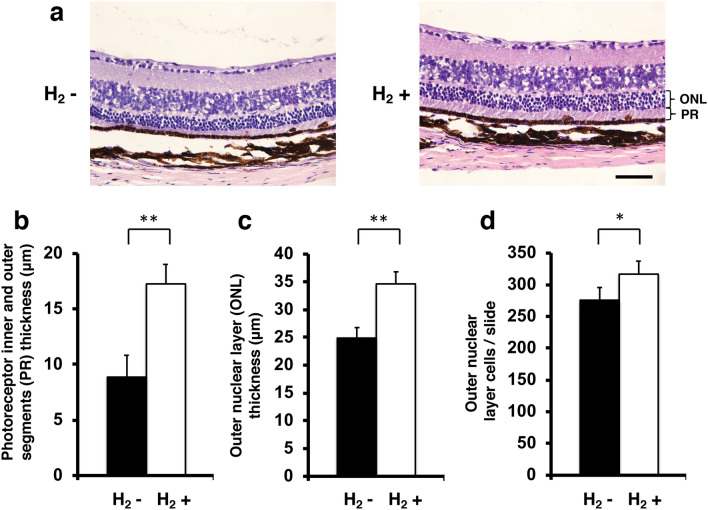
Figure 4.
Thickness of photoreceptor inner and outer segments and outer nuclear layer and number of outer nuclear layer cells. (a) Images of representative slices from the control group (n = 4) and H2 group (n = 4). Photoreceptor inner and outer segments (PR) thickness and outer nuclear layer (ONL) are shown. (b) Photoreceptor inner and outer segments thickness with/without H2 water. Thickness was significantly greater with H2 water than without H2 water (p < 0.01). (c) Outer nuclear layer (ONL) thickness with/without H2 water. Thickness was significantly greater with H2 water than without H2 water (p < 0.01). (d) Outer nuclear layer cells/slide with/without H2 water. Thickness was significantly greater with H2 water than without H2 water (p < 0.05). Bars depict mean ± standard deviation (SD). Scale bar 50 μm. *p < 0.05, **p < 0.01.

