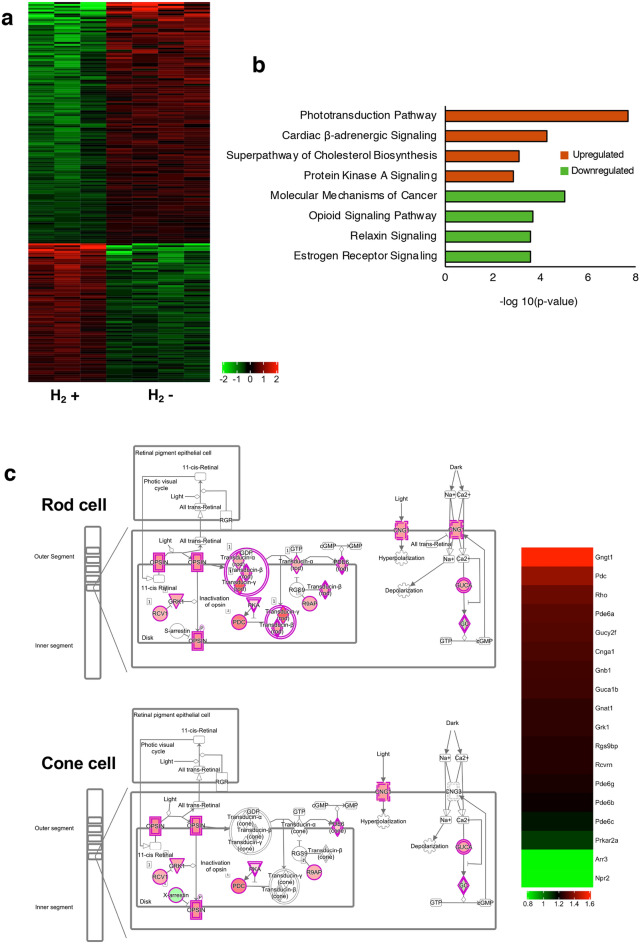
Figure 6.
RNA-seq analysis. (a) Heatmap based on differentially expressed genes. Each column represents a sample (H2 group: n = 3; control group: n = 4), and each row represents a gene. The expression level of each gene in a single sample is depicted according to the color scale. (b) Pathway analysis of the differentially expressed genes based on IPA. The top four most significant up- and downregulated pathways after drinking H2 water. (c) IPA pathway and heatmap of phototransduction. Red and green colors indicate that the genes are upregulated or downregulated, respectively.

