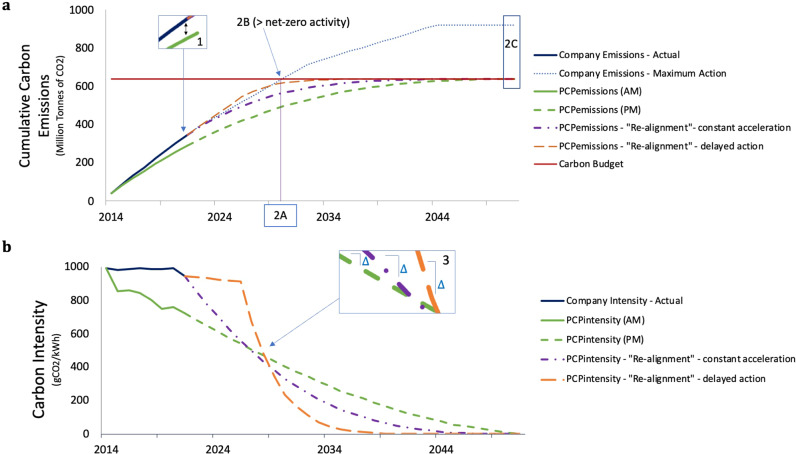
Fig. 2. Paris Compliant Pathways and transition performance metrics for the largest Australian electric utility company (AGL).
Both Panel a and Panel b show the same Paris Compliant Pathway (PCP) using the Sectoral Decarbonisation Approach on an existing company’s initial intensity (2014) and actual market share (green line) and projected market share (dashed green line), where Panel a shows carbon intensities and Panel b shows cumulative carbon emissions. It also shows two possible “re-alignment” PCP’s the company could follow to stay within its carbon budget: a PCP featuring a constant “accelerated” decarbonisation rate which commences immediately (dotted yellow line); and a PCP which follows recent (2014–2021) decarbonisation rates for the next 5 years, followed by a new accelerated decarbonisation rate (long-dashed orange line). Panel a shows Metric 1 and metric 2. Metric 1 measures the performance since the base year (cumulative emissions since the base year 2014 relative to the Climate-safe Emissions Pathway). Metric 2 is composed of three sub-metrics; 2A is the estimated year that the company carbon budget will be fully emitted based on a “maximum action” scenario of future cumulative emission projections, all assuming constant market-share (short dash). A “maximum action” scenario is based on the company’s most recently announced closure dates for fossil fuel generating assets and assumes the replacement of such assets with zero-emissions generation capacity and their market share being kept constant; 2B is the amount of activity in place under the “maximum action” scenario at the EYF with a positive emission intensity; 2C is the emissions under the “maximum action” scenario in 2050 compared to the carbon budget. Panel b also illustrates Metric 3 which measures the difference in decarbonisation rates between the PCPintensity and the “re-alignment” PCPintensity.

