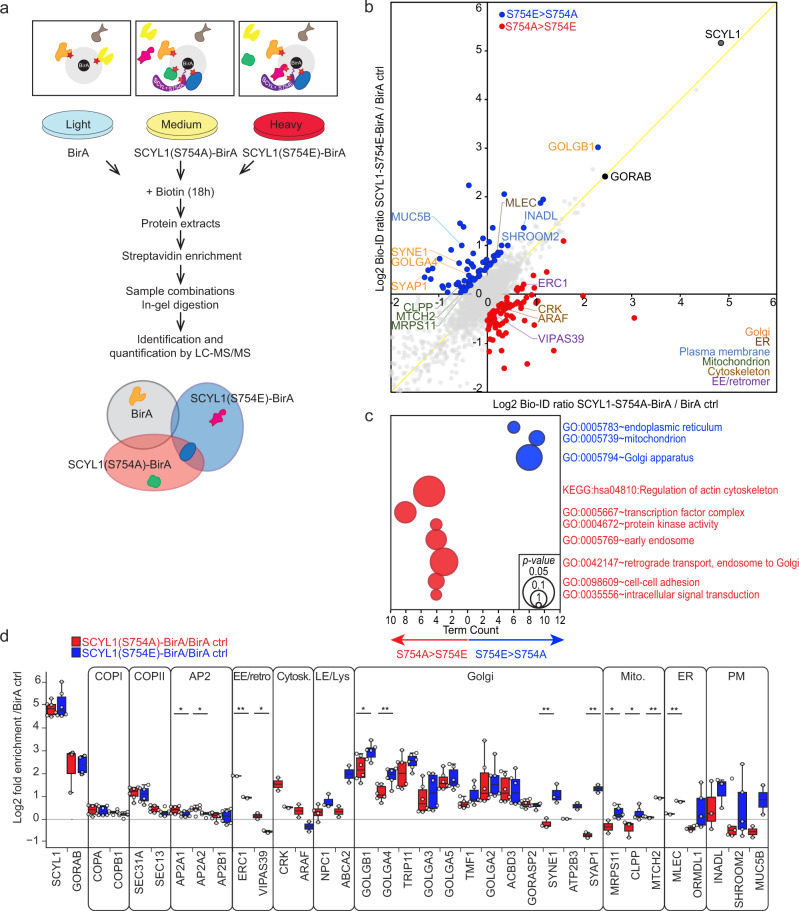
Fig. 7. SCYL1 Ser754 phosphorylation defines its association to distinct compartments.
a BioID workflow. SILAC-labeled SCYL1 KO MCF-7 cells re-expressing Tet-inducible SCYL1(S754A)-BirA or SCYL1(S754E)-BirA were used for streptavidin-based affinity enrichment compared to cells expressing BirA only as negative control. b SCYL1 S754A and S754E associate with different compartments. Scatter plot displaying normalized, averaged and Log2-transformed SILAC ratios from n = 6 biological replicates each. SCYL1 and GORAB are highlighted with black dots. Gray dots: all data points; red dots: enriched proteins (Log2 difference ≥0.5) in SCYL1(S754A)-BirA; blue dots: enriched proteins (Log2 difference ≥0.5) in SCYL1(S754E)-BirA. IDs of Proteins belonging to cellular compartments significantly enriched in GO/KEGG term analysis in c, d are highlighted with compartment-specific colors. Yellow diagonal indicates full correspondence between both variants. Source data for this graph are available in Supplementary Data 4. c GO/KEGG term enrichment analysis of proteins enriched in SCYL1 S754A and S754E BioID. Bubble plot of significant GO/KEGG terms associated with differentially enriched proteins shown in b. Red circles: proteins enriched in SCYL1(S754A)-BirA; Blue circles: proteins enriched in SCYL1(S754E)-BirA. A full list of all enriched GO terms is available in Supplementary Data 4. GO term enrichment p-values were calculated via DAVID functional annotation tool EASE Score77. d SCYL1(S754A)-BirA is more proximal to cytoskeleton and early endosome, whereas SCYL1(S754E)-BirA is more proximal to late endosome/lysosome, mitochondrial and Golgi/ER proteins. Box plot showing average SILAC ratios of SCYL1(S754A)-BirA/BirA (red) and SCYL1(S754E)-BirA/BirA (blue). Individual replicates are shown as white circles. Interactors are grouped by category: EE/retro, early endosome and retrograde transport to Golgi; Cytosk, cytoskeleton; LE/Lys, Late endosome and lysosome; Mito., mitochondrion; PM, plasma membrane. All center lines within the box plots indicate median values; box limits indicate the upper and lower quartiles of the plotted values, upper and lower whiskers indicate the largest and smallest values within the 1.5x IQR. N = 6 biological replicates were performed, and data were presented if at least two valid Log2-transformed ratios were available (white circles). Significant difference between SCYL1(S754A)-BirA/BirA and SCYL1(S754E)-BirA/BirA are displayed: unpaired two-tailed Student’s Student’s t-test; significant p-values: AP2A1: p = 0.054(*); AP2A2, p = 0.028(*); ERC1, p = 0.0013(**); VIPAS39, p = 0.041(*); GOLGB1, p = 0.019(*); GOLGA4, p = 0.0049(**); SYNE1, p = 0.0093(**); SYAP1, p = 0.011(**); MRPS11, p = 0.053(*); CLPP, p = 0.018(*); MTCH2, p = 0.0026(**); MLEC, p = 0.0049(**). Source data are provided as Source Data file and in Supplementary Data 4.

