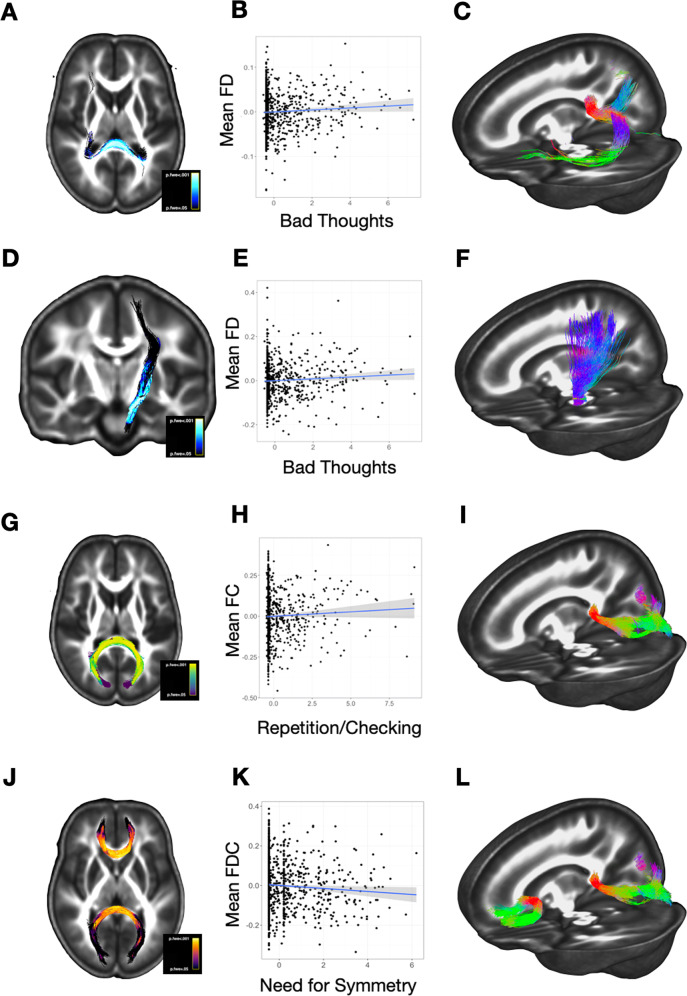
Fig. 3. Fixel correlates of OCS dimensions.
Panels in the left column (A, D, G, J) display the significant regions of association for main OCS-fixel findings. The center column (B, E, H, K) presents scatterplots of the assocation between each respective trait (x-axes) and the fixel-based value (y-axes). Scatterplots of these effects were generated post-hoc, and should not be interpreted as correlations. The right column contains tractograms that further characterize the anatomy of these results (C, F, I, L); each significant ROI was used as a seed region and probabilistic tractography was used to construct the tractograms.

