
Fig. 1. Spaceflight-induced changes of gene expression related to neuronal function.
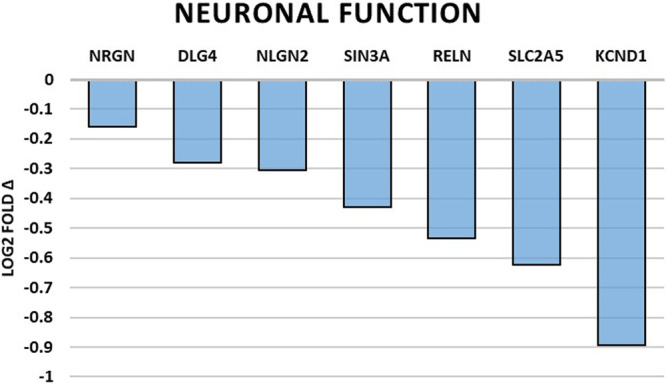
Bar graph summarizing log2 fold-changes of significantly differentially expressed genes (DEG) (p < 0.05) in the flight (FLT) group compared to the ground control (GC) group in genes directly related to neuronal function. N = 6/group. p values are calculated using one-way analysis of variance (ANOVA) and Tukey’s HSD (honestly significant difference) test. Source data are provided as a Source Data file.