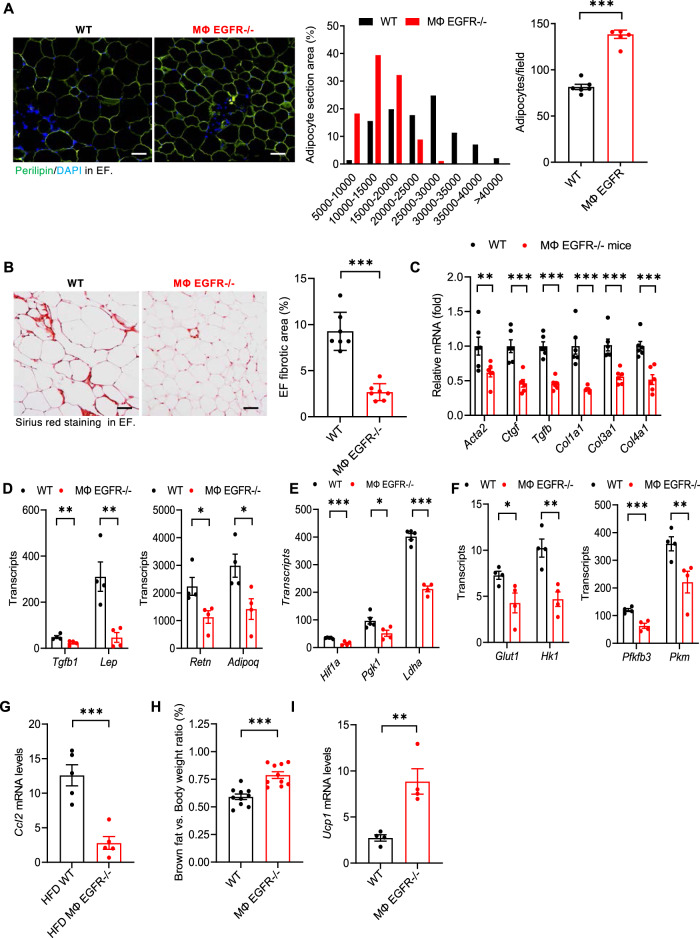
Fig. 5. Myeloid EGFR−/− mice had reduced adipocyte hypertrophy and adipose tissue adipokines, glycolysis, hypoxia, and fibrosis in response to the HFD.
WT and MΦ EGFR−/− mice were fed the HFD for 12 weeks. A Image analysis of perilipin immunofluorescence showed smaller but increased adipocytes in EF in MΦ EGFR−/− mice than WT mice. N = 10, scale bar = 100 μm. B Quantitative Sirius Red staining indicated less fibrosis in EF in MΦ EGFR−/− mice than WT mice. N = 6, scale bar = 100 μm. C–G MΦ EGFR−/− mouse EF had lower profibrotic and fibrotic genes including Acta2, Ctgf, Tgfb1, Col1a1, Col3a1, and Col4a1, n = 6 C, lower adipokine genes including Lep, Adipoq, Retn, and Tgfb1, n = 4 D, lower hypoxia-related genes including Hif1a, Pgk1, and Ldha, n = 4 E, lower glycolytic genes including Glut1, Hk1, Pfkfb3, and Pkm, n = 4 F, and lower chemoattractant Ccl2 gene, n = 5 G. H, I MΦ EGFR−/− mice had higher interscapular brown fat, n = 10 H and higher inguinal fat Ucp1 transcripts, a beige marker, n = 4 I. Data are means ± SEM, **P < 0.01, ***P < 0.001, analyzed using 2 tailed Student’s t test for A, B, G–I, and 2-way ANOVA followed by Bonferroni’s post hoc test for C–F.

