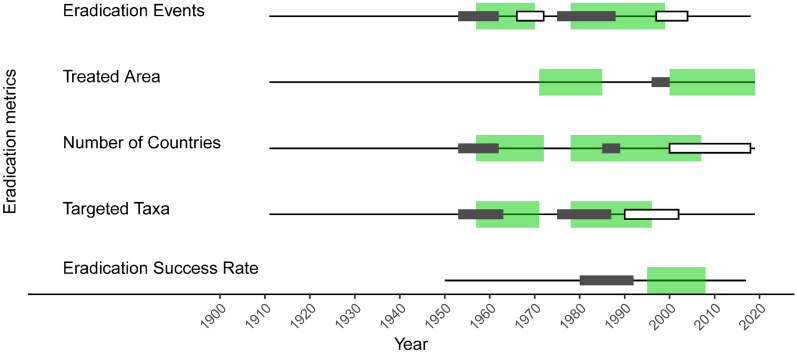
Figure 3.
Eradication timeline analysis, 1900–2019. Significant periods of change over time are shown for the eradication metrics displayed as curves in Fig. 2 (annual number of eradication events (2b), treated island area (2d), countries implementing eradications (2f), invasive taxa targeted for eradication (2h)) and Fig. 4 (eradication success rate). Significant periods are indicated when lasting five or more years: positive gradient (i.e., increasing slope, wide green bar), positive curvature (i.e., acceleration; narrow dark bar), and negative curvature (i.e., deceleration; narrow white bar). There were no periods of significant negative gradient (i.e., decreasing slope) for any of the analyzed metrics.

